Random screening-based feature aggregation for point cloud denoising
In one sentenceA point cloud denoising network that randomly screens each local patch and fuses the denser patch’s global feature into its sparser points, making denoising more robust to severe noise and irregular point density.
The problem
Point clouds captured by sensing devices are contaminated by noise from the environment and the limited precision of the devices, which corrupts the geometry they describe. Traditional optimisation-based denoising needs careful parameter tuning and can struggle to remove noise and preserve features at the same time. Learning-based methods ease the tuning, but they are usually trained on data with uniform point distributions and densities, and they become less robust when the noise is severe or the point density varies.
A common way to fully exploit point position information is to fuse the features of larger patches into smaller sub-patches. That technique is typically used when the training data has a uniform point resolution, which can make the network less robust on points with varying sampling density. This paper instead screens points at random and fuses the denser patch’s global feature into the remaining points.
How it works
The network denoises each point from its local patch. An encoder extracts point features; two random screening-based feature aggregation modules then each drop half of the points at random and fuse the global feature of the denser patch (the patch before screening) into the half of the points that remain. Finally, point-wise weights decide how much each remaining point contributes to the displacement that moves the noisy point towards the clean surface.
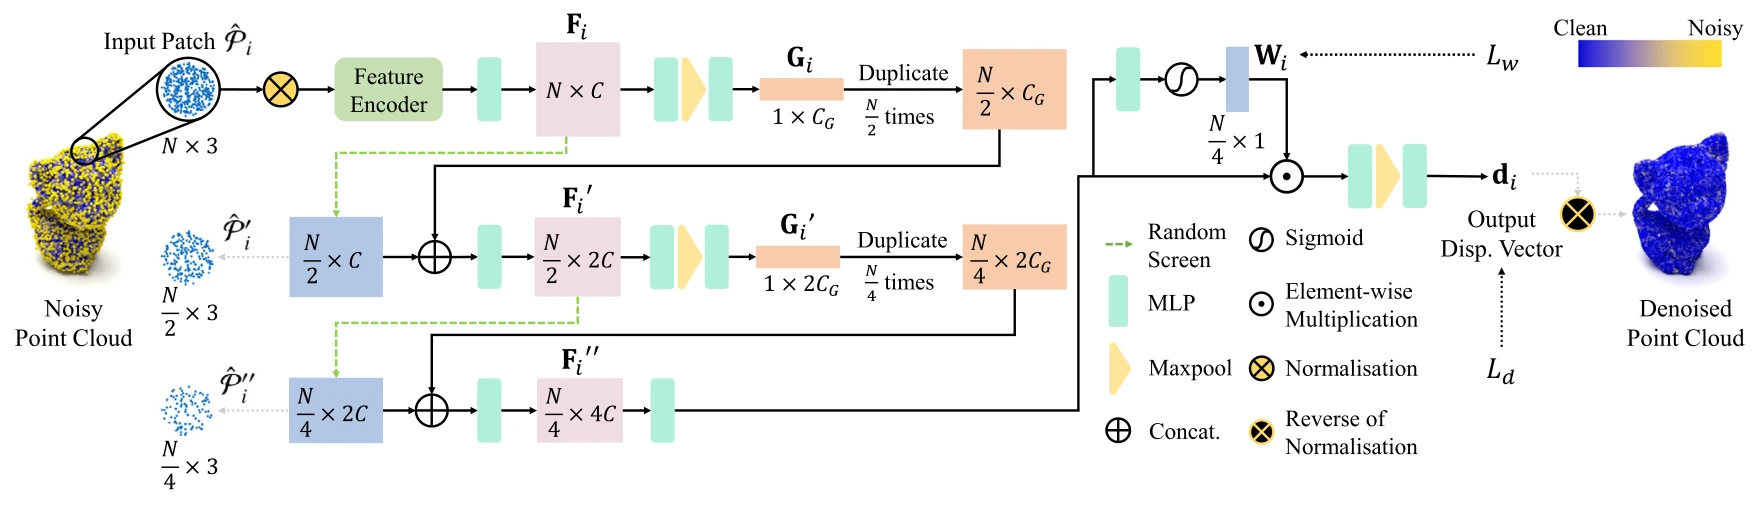
- Build a local patch. For each noisy point, the neighbours within a ball of radius r (5 % of the bounding-box diagonal) form a patch. The patch is translated to the origin, scaled to a unit sphere, rotated into a canonical pose by PCA, and padded or downsampled to N = 500 points.
- Encode and screen. A graph-based encoder with Dense Blocks produces an N × C feature matrix. The network extracts a global feature from it and randomly keeps half of the point features.
- Fuse dense into sparse. The global feature is copied N/2 times and concatenated with the features of the screened sub-patch; an MLP turns them into an N/2 × 2C matrix. The sparser sub-patch now carries richer geometric information from the denser patch.
- Repeat once more. The same screening and fusion run again, leaving N/4 points with 4C channels each. In the paper’s ablation, this two-stage cascade is more effective than a single aggregation layer.
- Weight and move. The network regresses a weight for each of the N/4 points; a weighting loss trains points closer to the tangent plane of the patch centre to receive higher weights. The weighted features are max-pooled and decoded into a displacement vector, which is added to the noisy point. Training combines this weighting loss with a surface proximity loss.
Results
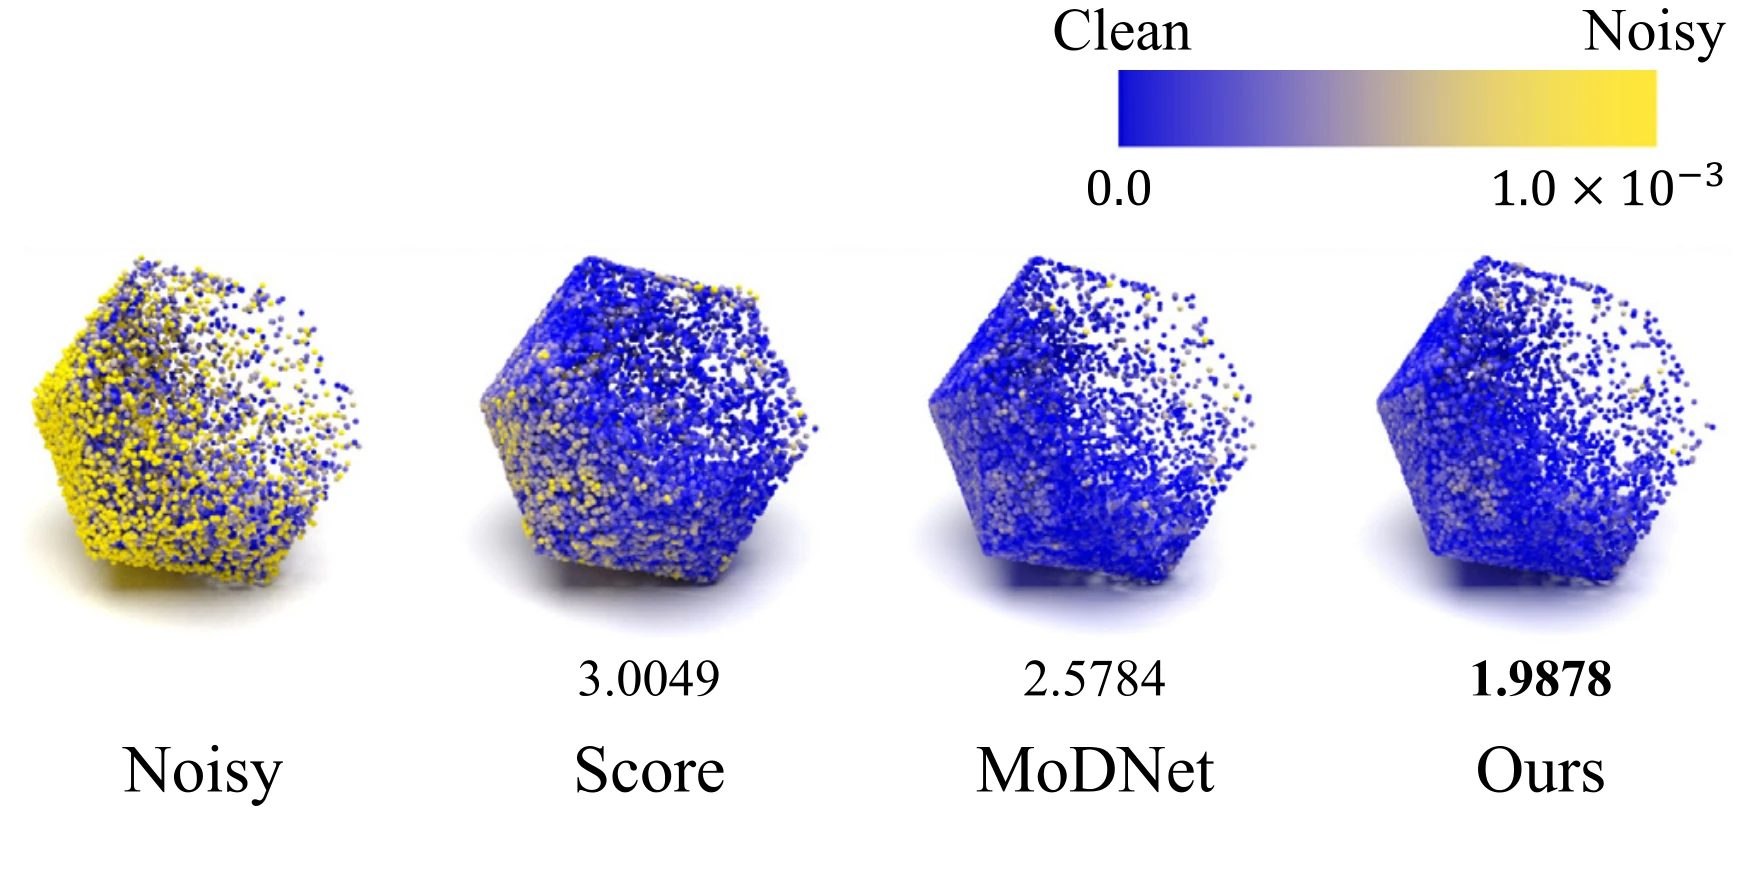
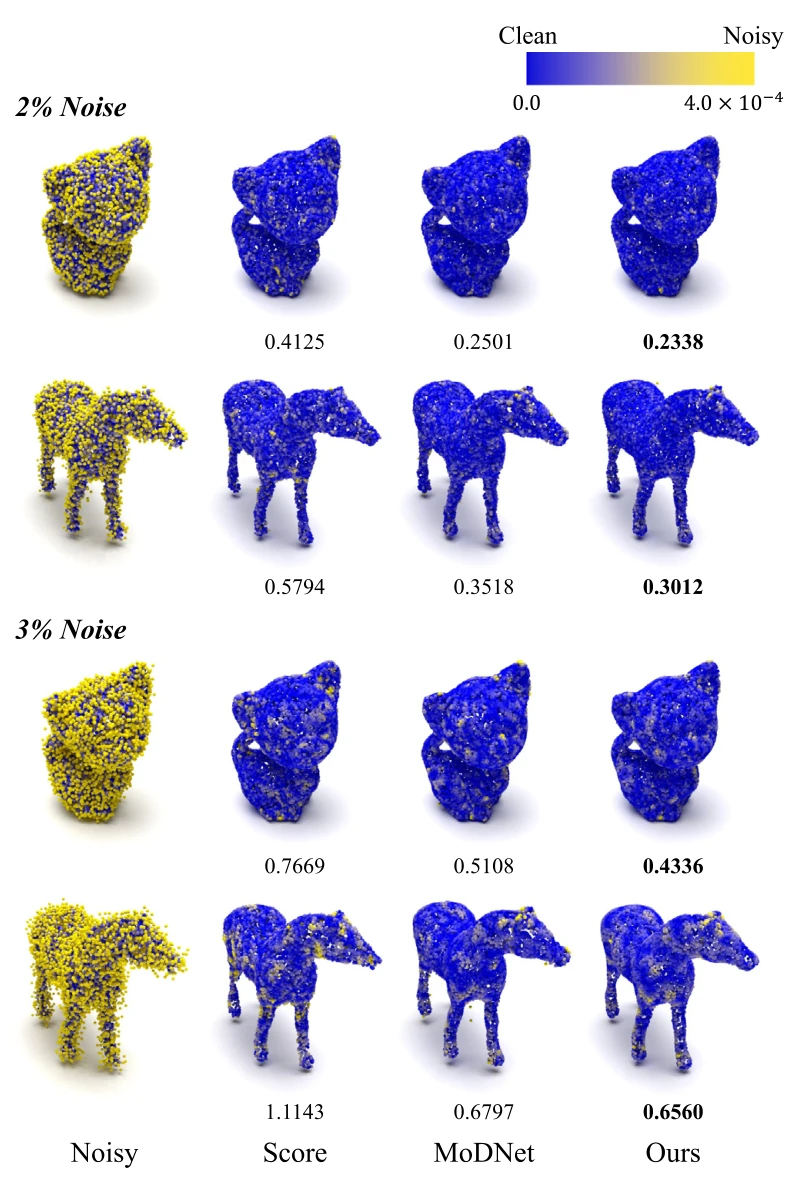
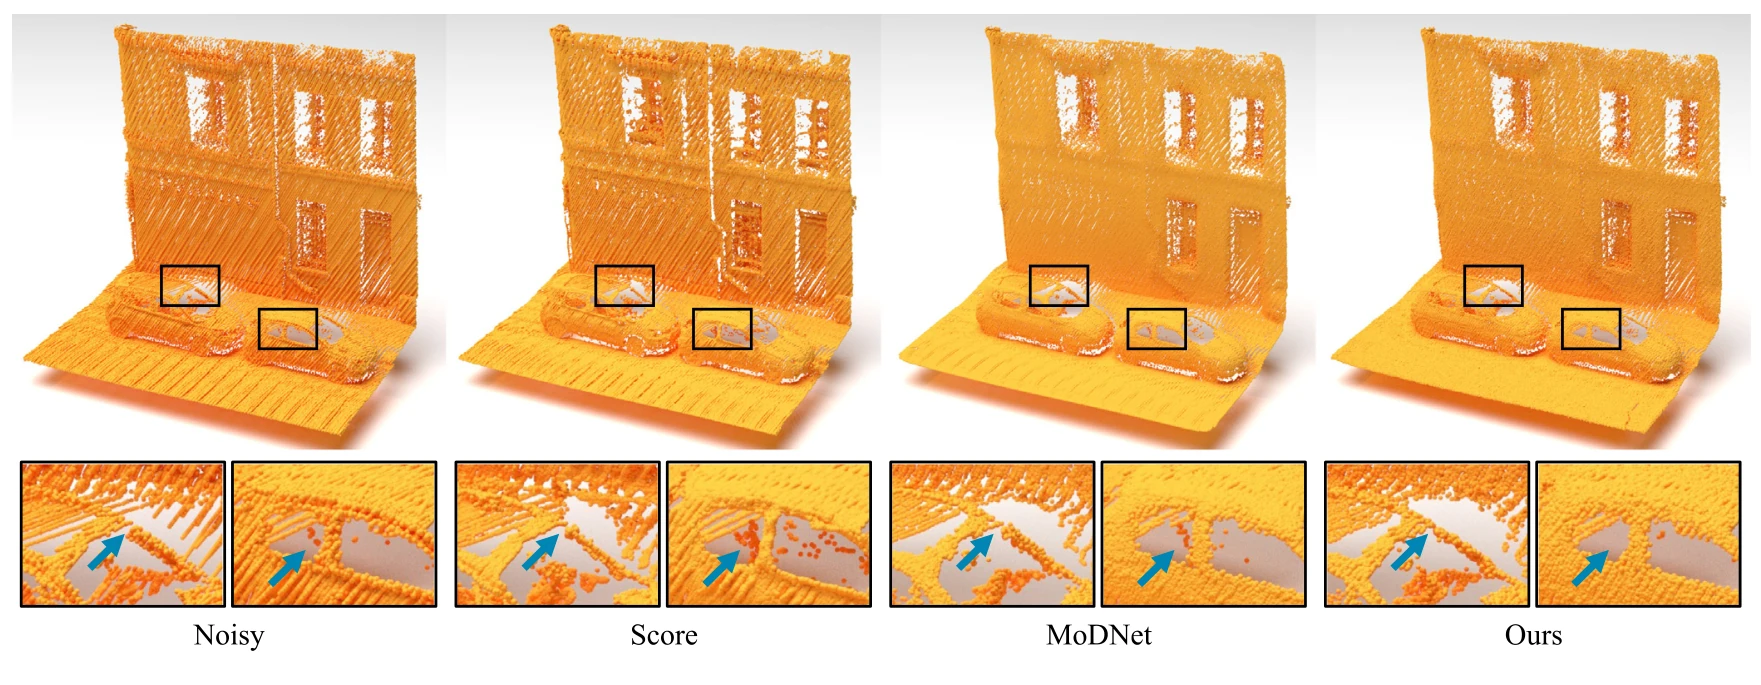
The network is trained on PUNet’s 40 training shapes, with Gaussian noise of 0.5 % to 2 % of the bounding-sphere radius added on the fly. The PUNet test set has 20 shapes at 10,000 and 50,000 points, each with 1 %, 2 % and 3 % noise; the method has the lowest Chamfer distance (CD) and point-to-mesh distance (P2M) in most of these settings and on average. On real depth-camera scans from the Kinect Fusion dataset, whose noise differs from Gaussian noise, it has the lowest P2M on all three scans shown (Fig. 4), and it also leads on the irregularly sampled icosahedron above. The Paris-rue-Madame street scans, captured by a mobile laser scanner, have no ground truth, so that comparison is visual only (Fig. 6).
Two further checks support the design. Keeping half of the features at each screening step gives the lowest P2M, 0.961, against 1.270, 1.254 and 1.251 for ratios of 1/3, 2/3 and 3/4 (Table 4). Compared with the cascaded scale feature aggregation used in earlier work, the method performs similarly at lower noise levels but preserves geometry better under severe noise (Fig. 7). The denoised point clouds can also be turned into meshes with Poisson reconstruction, where the paper shows more accurate results on edges and complicated regions (Fig. 8).
Cite
@article{wang2023random,
  title={Random screening-based feature aggregation for point cloud denoising},
  author={Wang, Weijia and Pan, Wei and Liu, Xiao and Su, Kui and Rolfe, Bernard and Lu, Xuequan},
  journal={Computers \& Graphics},
  volume={116},
  pages={64--72},
  year={2023},
  publisher={Pergamon},
  doi={10.1016/j.cag.2023.08.013}
}