An Improved Graph Attention Network for Semantic Segmentation of Industrial Point Clouds in Automotive Battery Sealing Nail Defect Detection
Accurate defect detection in automotive battery sealing nails is vital for safety and reliability. LGASS is an end-to-end 3D point cloud segmentation model that processes structured-light scans directly, replacing the traditional split workflow of 2D localization followed by 3D measurement with a single defect localization and quantification stage.
This work appears in Engineering Applications of Artificial Intelligence, 163(1):112793.
Problem setting
Accurate defect detection in automotive battery sealing nails is vital for safety and reliability. Traditional methods combine two-dimensional (2D) vision for localization with three-dimensional (3D) vision for measurement, resulting in complex workflows and reduced efficiency. We propose Local Graph Attention for Semantic Segmentation (LGASS), an end-to-end 3D point cloud segmentation model.
The figures below collect representative visual evidence from Engineering Applications of Artificial Intelligence, 163(1):112793.
Method and visual evidence
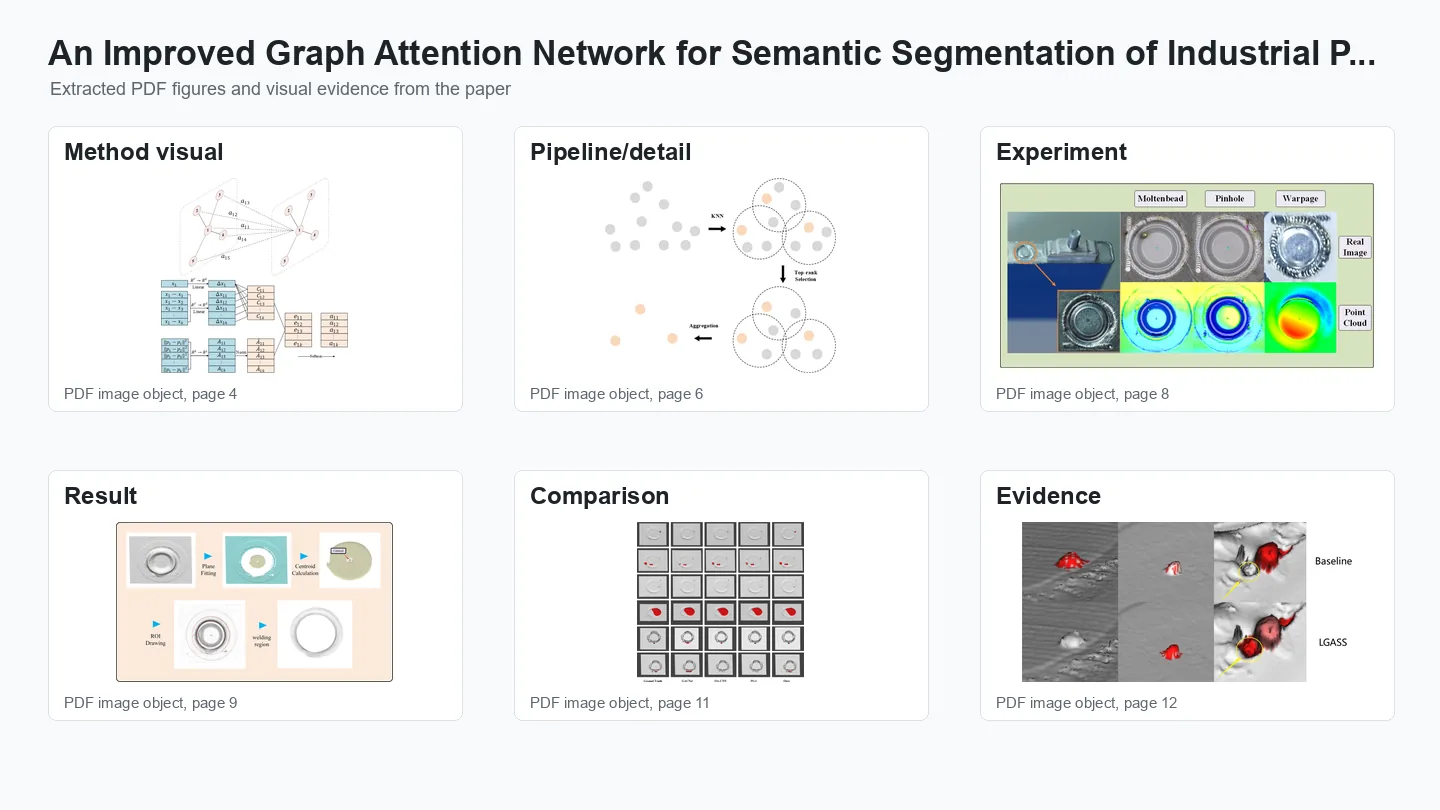
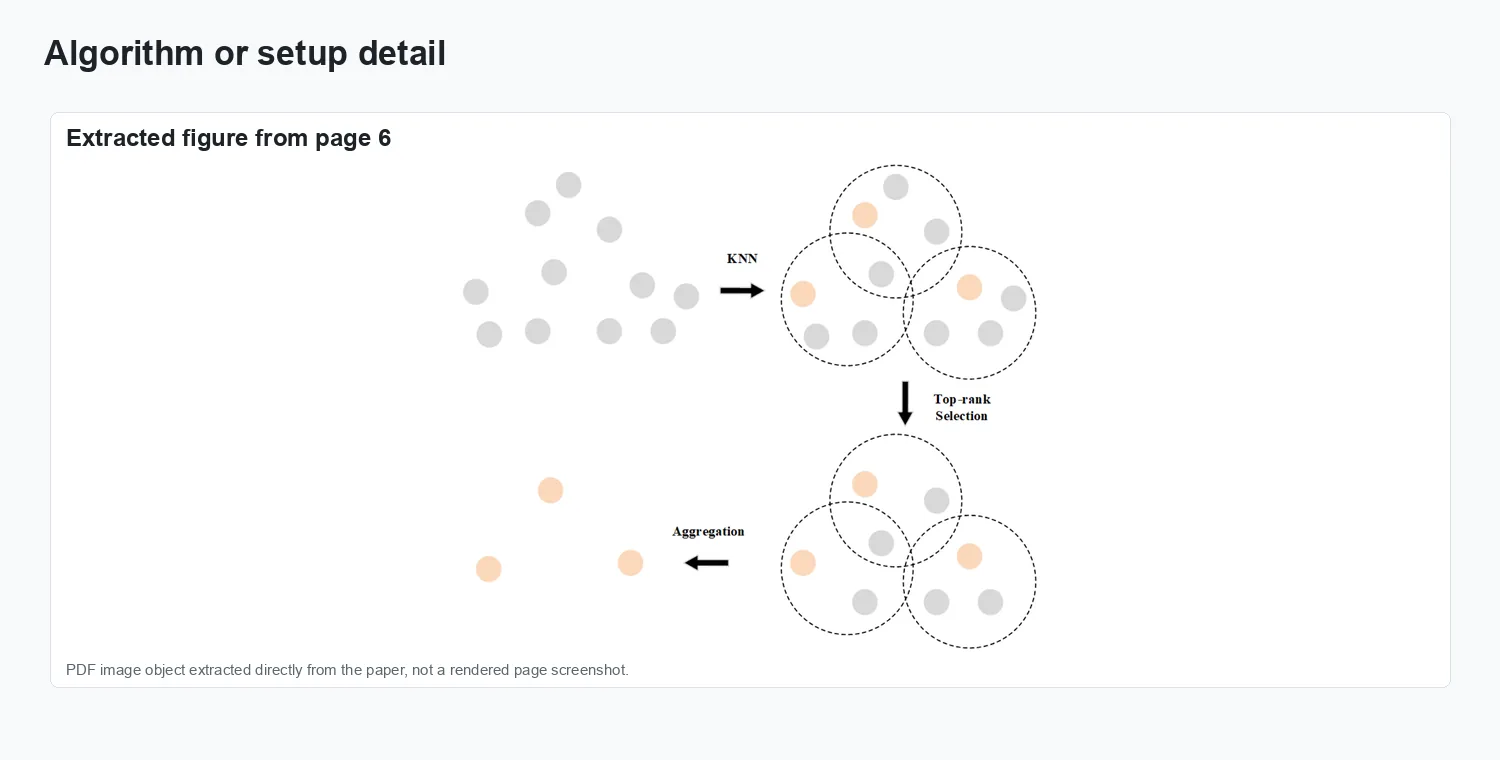
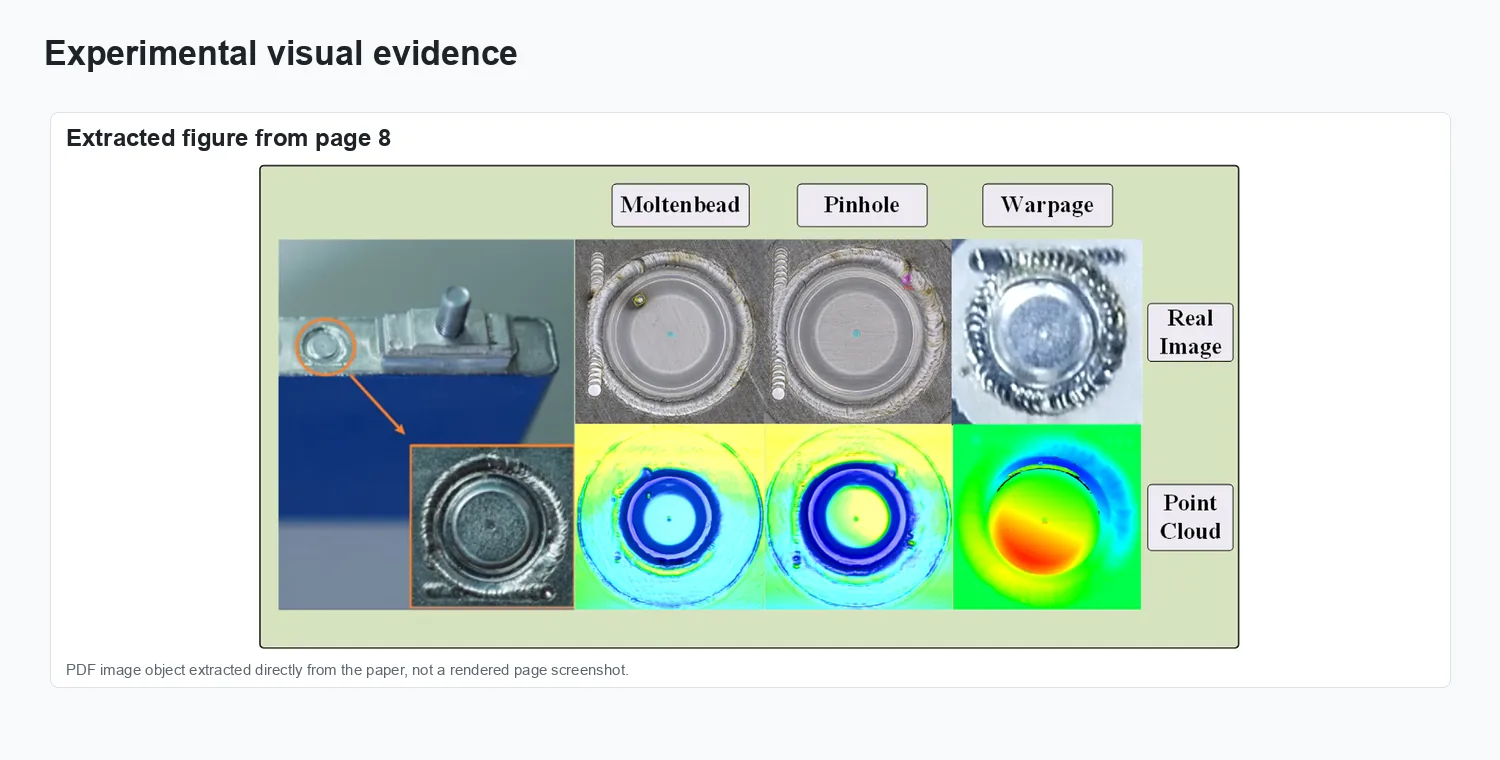
The visuals show structured-light point clouds of battery sealing nails, the local graph-attention segmentation architecture, and defect measurement results.
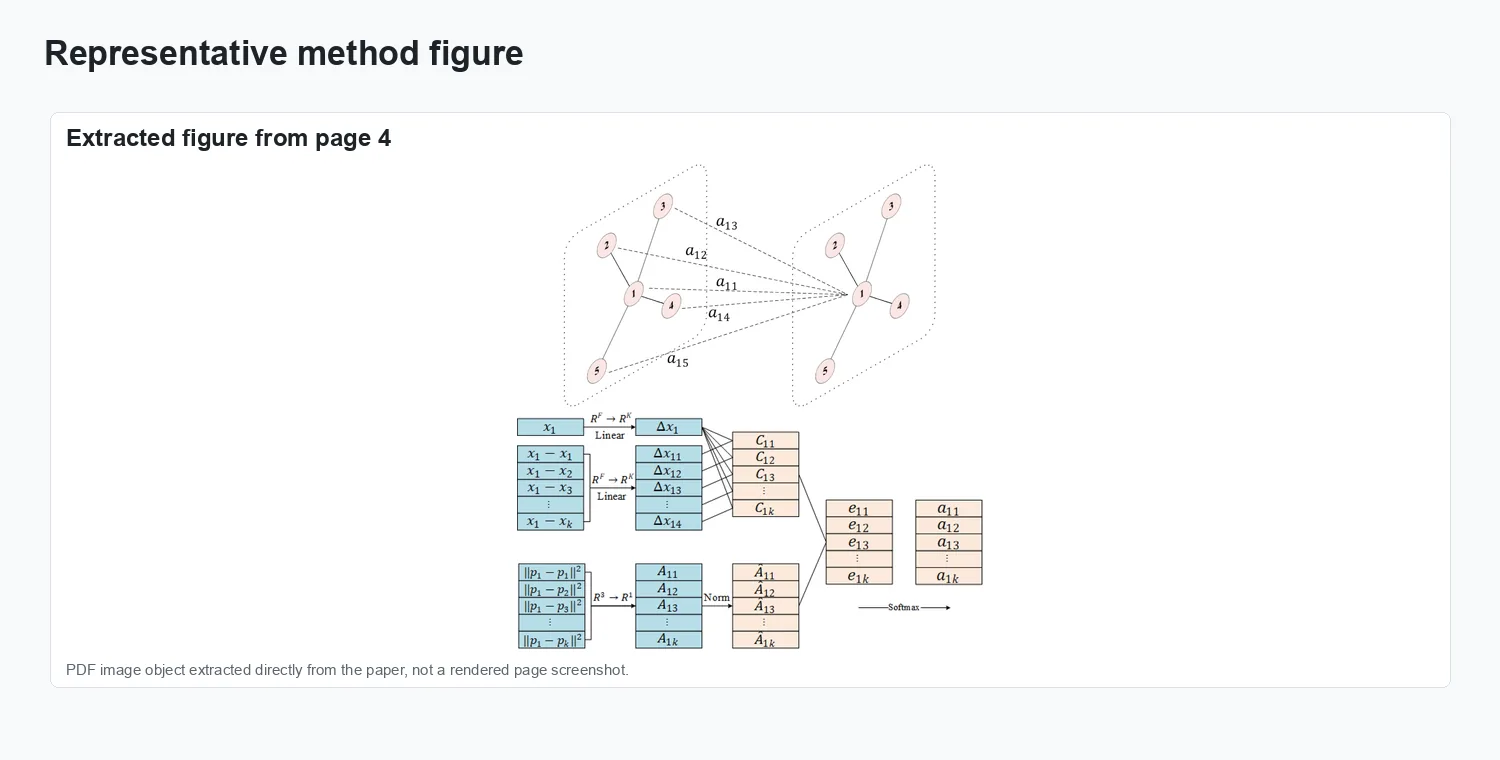
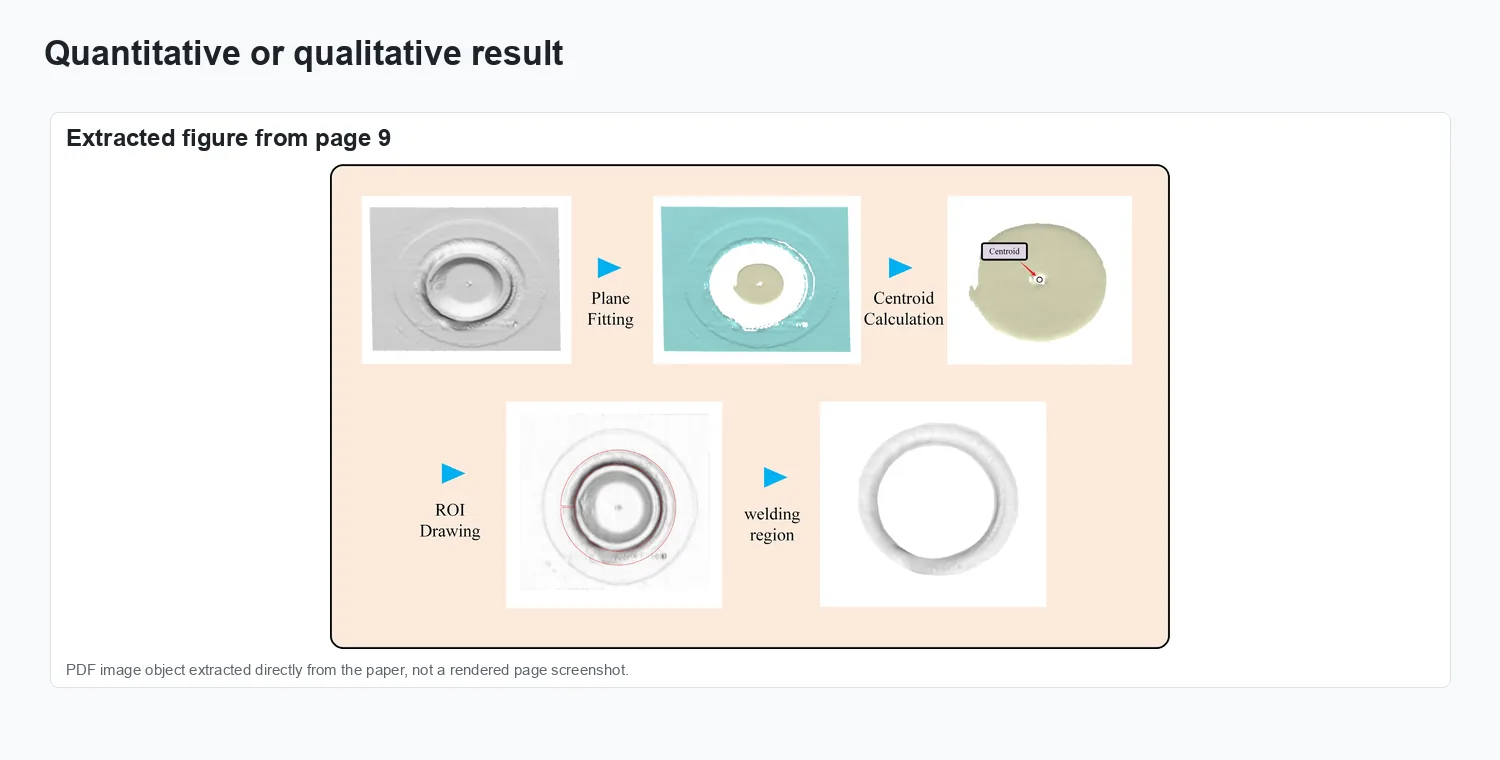
Method overview.
Representation and setup.
Experimental evidence.
Result comparison.
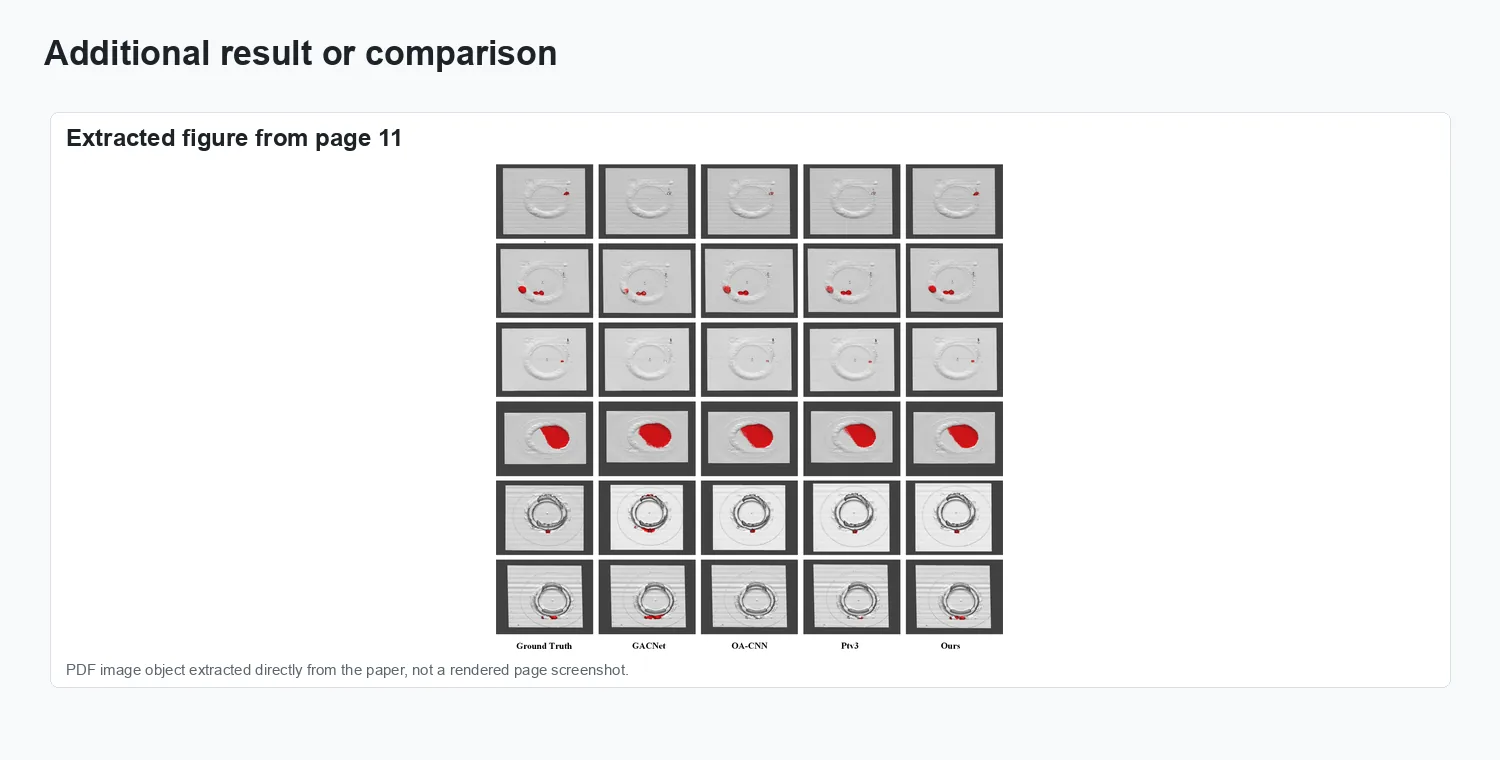
Additional visual result.
Results and impact
The evaluation reported in Engineering Applications of Artificial Intelligence, 163(1):112793 is summarized through the figures above.