Gap measurement method based on projection lines and convex analysis of 3D point clouds
Gap and flush measurement between adjacent body panels is a standard quality checkpoint in automotive assembly, yet automating it reliably remains difficult. Contact gauges are slow and require manual positioning; existing vision-based methods often struggle with specular surfaces, varying lighting, and complex curvatures near the gap edges. This paper proposes a fully geometric solution that operates directly on 3D point clouds acquired by a structured light scanner. The method projects the point cloud onto a series of cross-sectional planes perpendicular to the gap direction, applies projection-line fitting to each face of the gap, and uses convex analysis to robustly locate the gap boundary even when points are noisy or non-uniformly distributed. Gap width and surface flush are then computed analytically from the fitted geometric primitives, without thresholding or image segmentation. Validated on real automotive panel assemblies and published in Measurement Science and Technology (2024), the approach achieves measurement accuracy within 0.05 mm across a range of gap widths and panel materials, meeting automotive production tolerances with a fully non-contact, automatable workflow.
Problem setting
Accurate gap measurement between assembled components—such as body panels in automotive manufacturing—is critical for quality control but challenging to automate with contact-based gauges. This work presents a non-contact method that measures gaps directly from 3D point cloud data captured by structured light or laser scanners. The approach projects points onto cross-sectional planes, fits boundary lines to each gap face, and applies convex analysis to robustly identify the gap edges even in the presence of noise and surface curvature.
The figures below collect representative visual evidence from Measurement Science and Technology, 35(10):105024.
Method and visual evidence
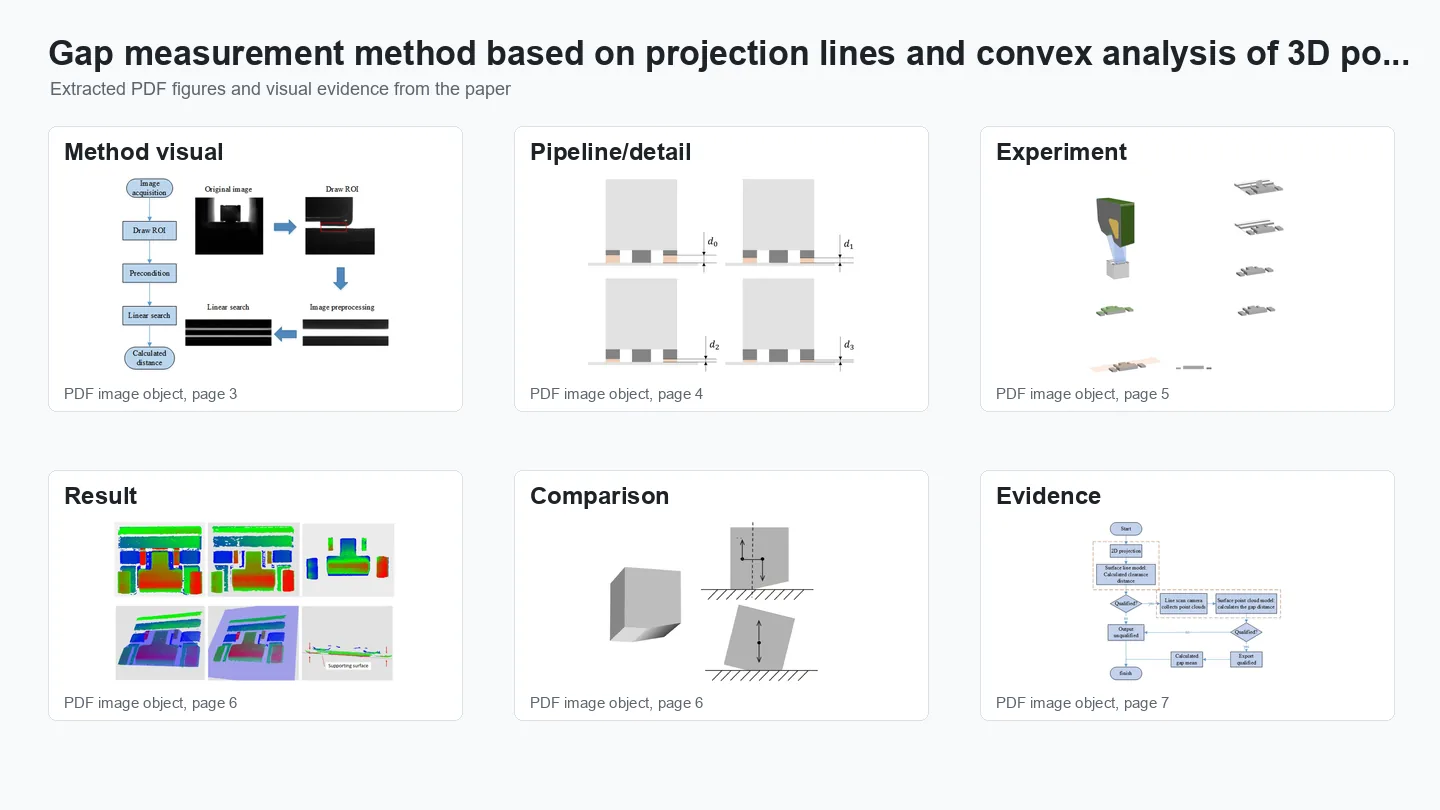
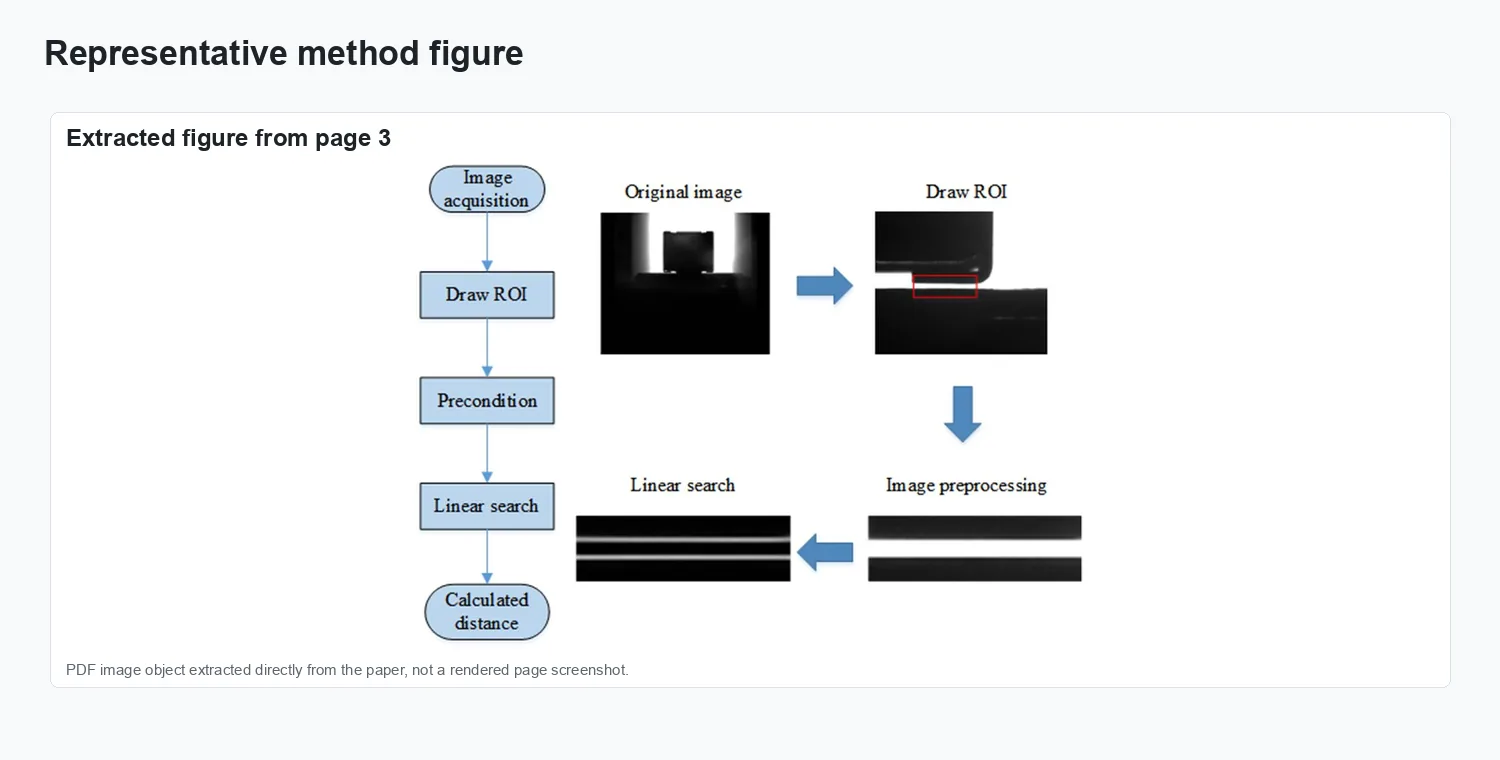
The visuals show projection-line construction, convex gap-edge analysis, and measurement comparisons on assembled parts.
Method overview.
Representation and setup.
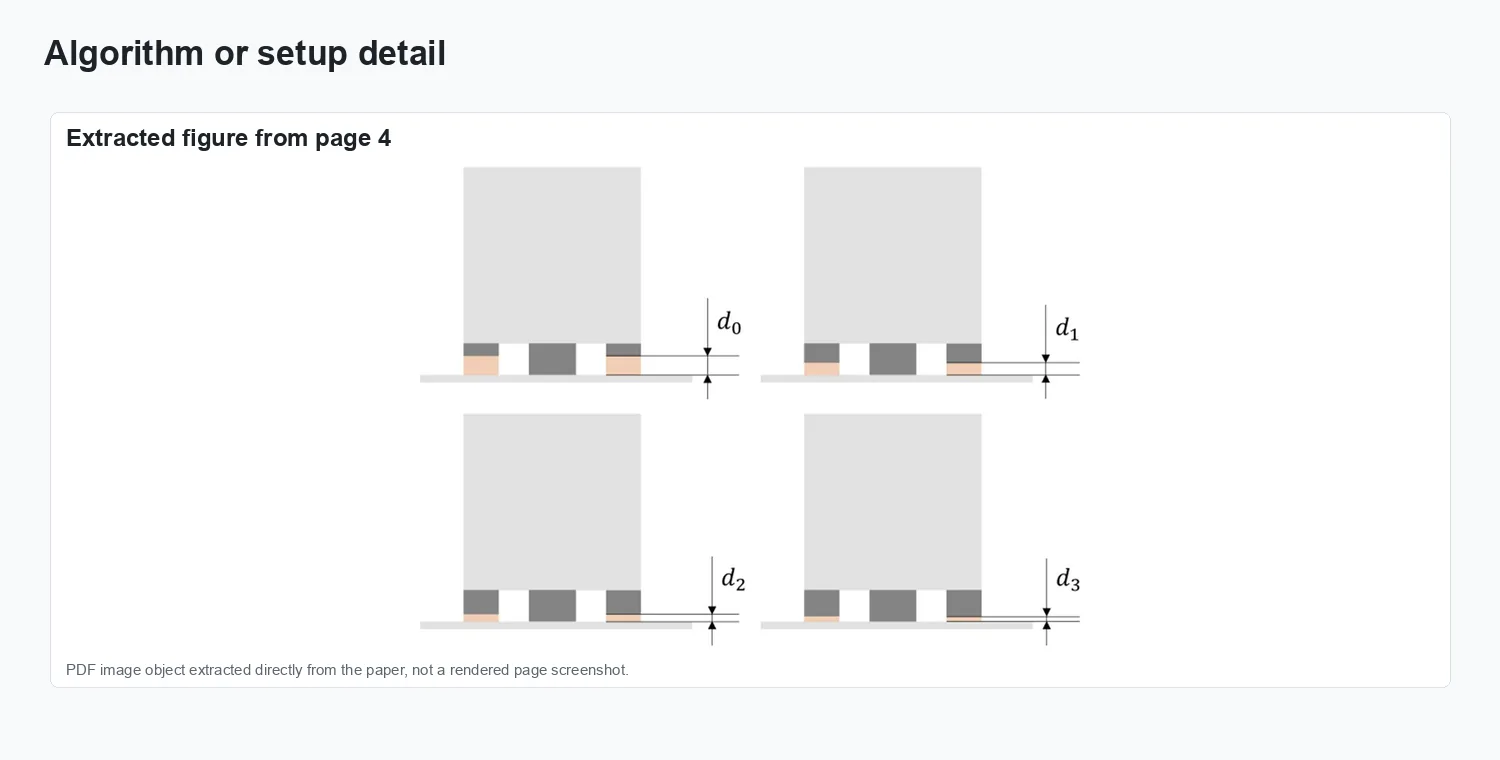
Experimental evidence.
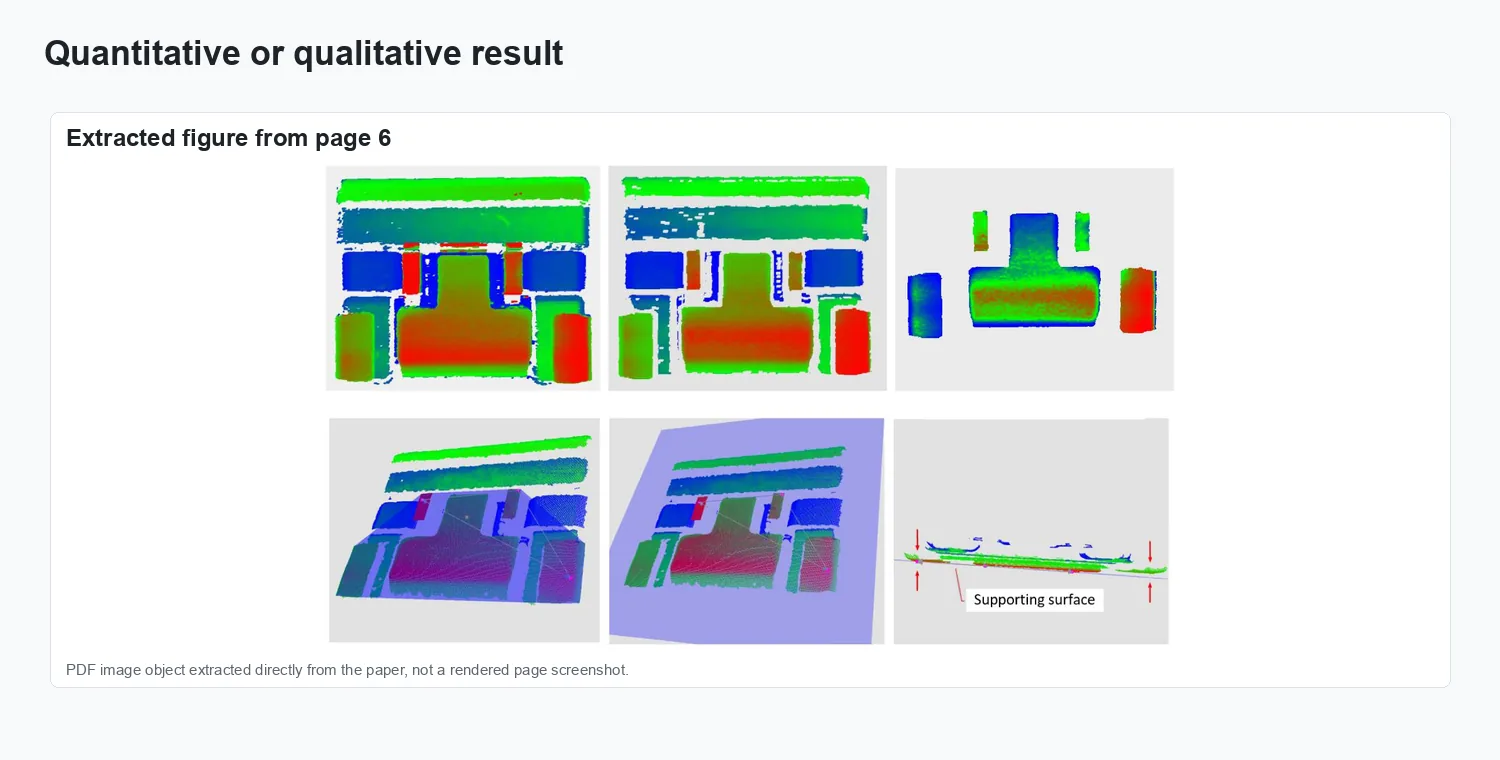
Result comparison.
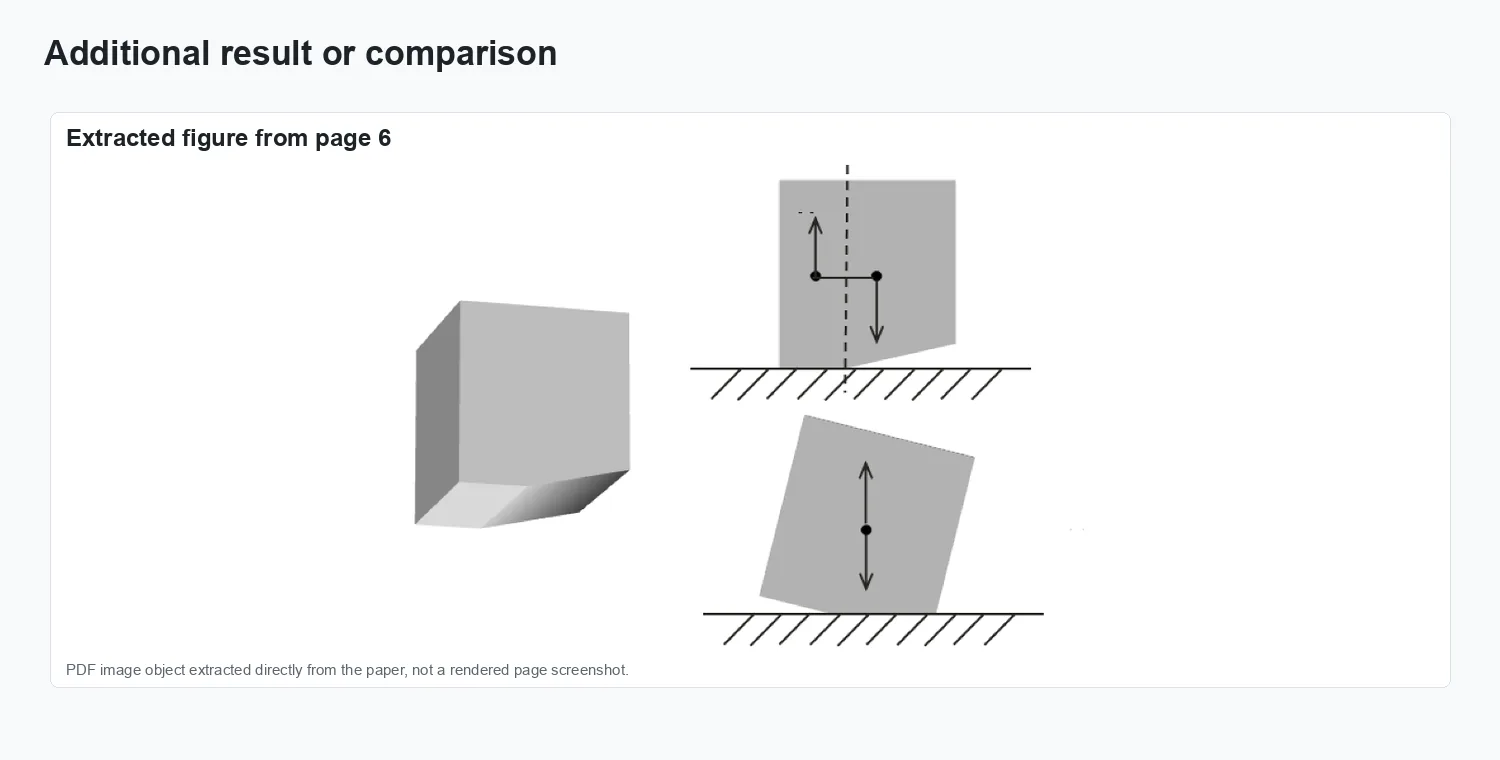
Additional visual result.
Results and impact
The evaluation reported in Measurement Science and Technology, 35(10):105024 is summarized through the figures above.