Sequencing in Transformation of Rasterized 3D Models
This thesis studies the sequencing problem behind transformations of rasterized 3D structures: how to move from one discrete shape to another through feasible intermediate states while respecting assembly, collision, and pick-and-place constraints.
The work connects voxelized model transformation, LEGO assembly planning, and process sequencing for automated fabrication. It appears as Wei Pan’s Ph.D. thesis at Singapore University of Technology and Design.
Problem setting
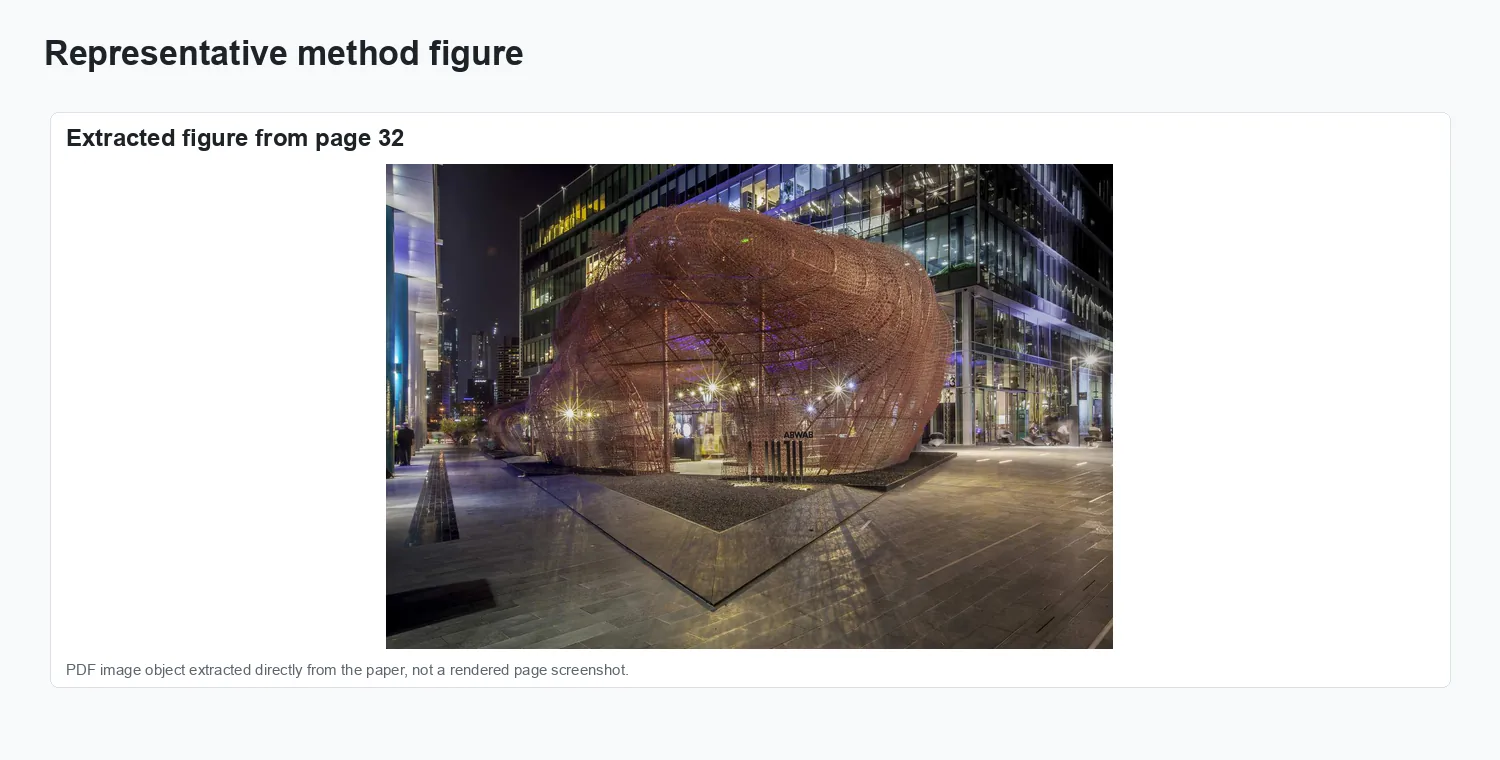
Rasterized 3D models are easy to represent but hard to transform automatically when the system must output an executable sequence rather than only a target geometry. The thesis formulates this as a sequencing problem over discrete structures and studies how to preserve feasibility across the transformation.
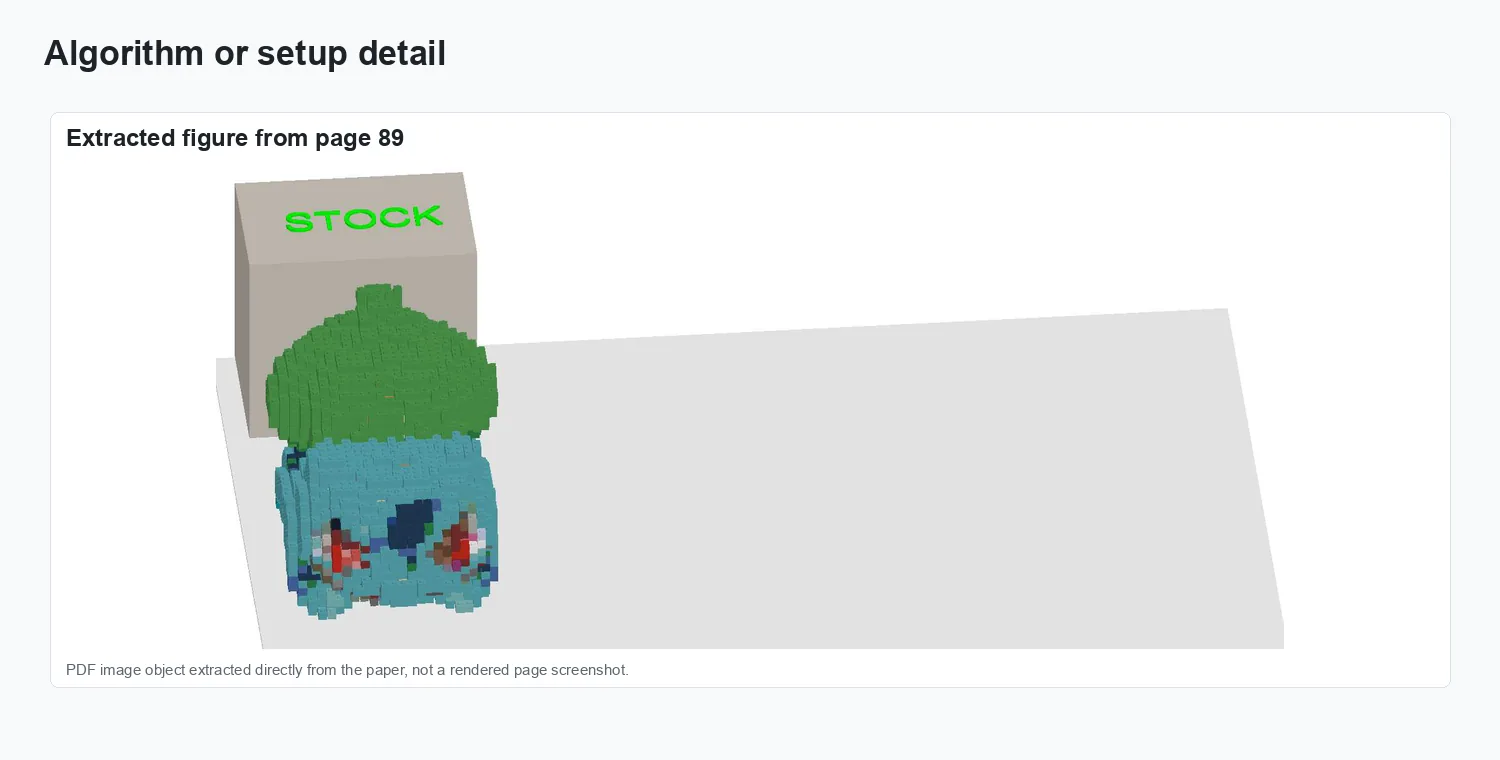
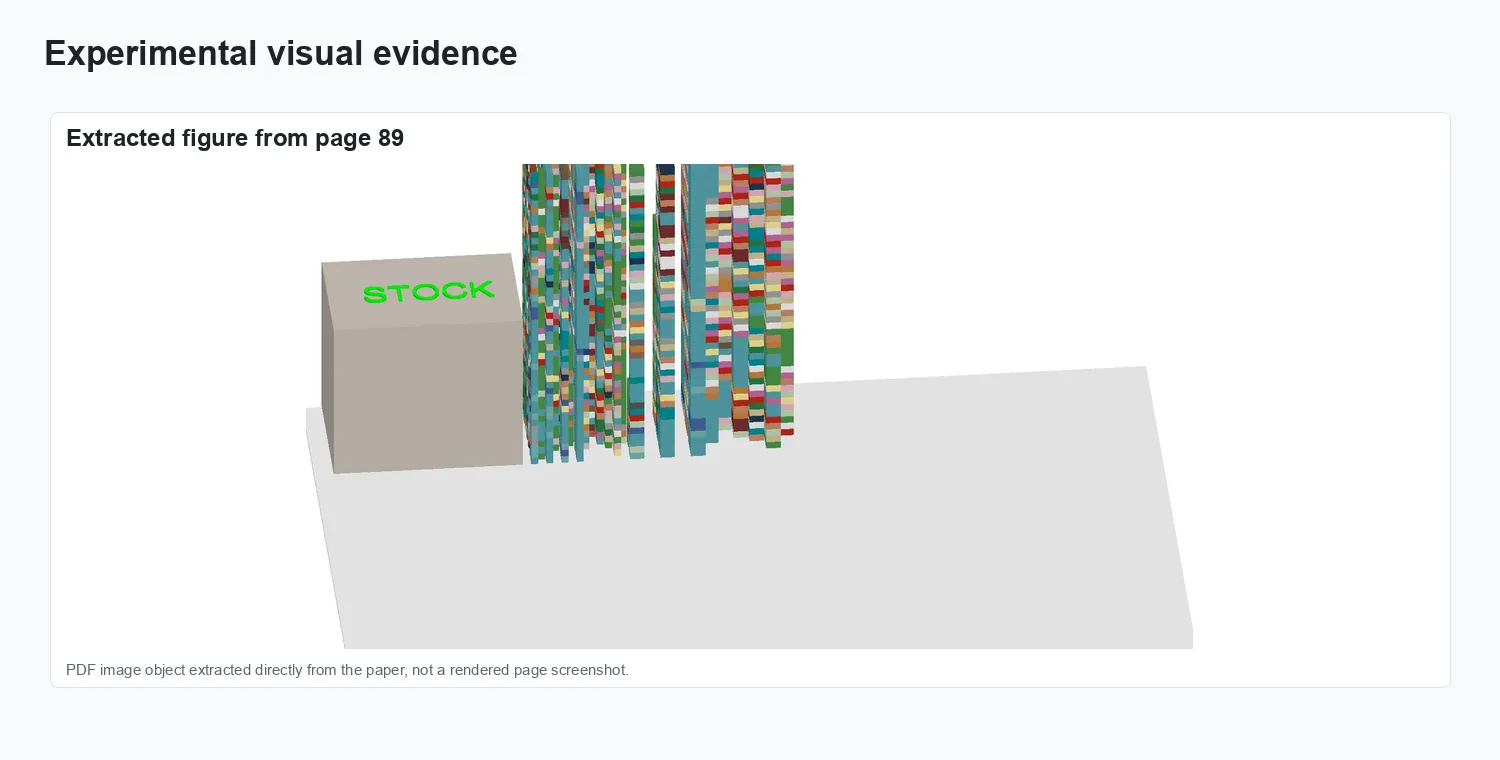
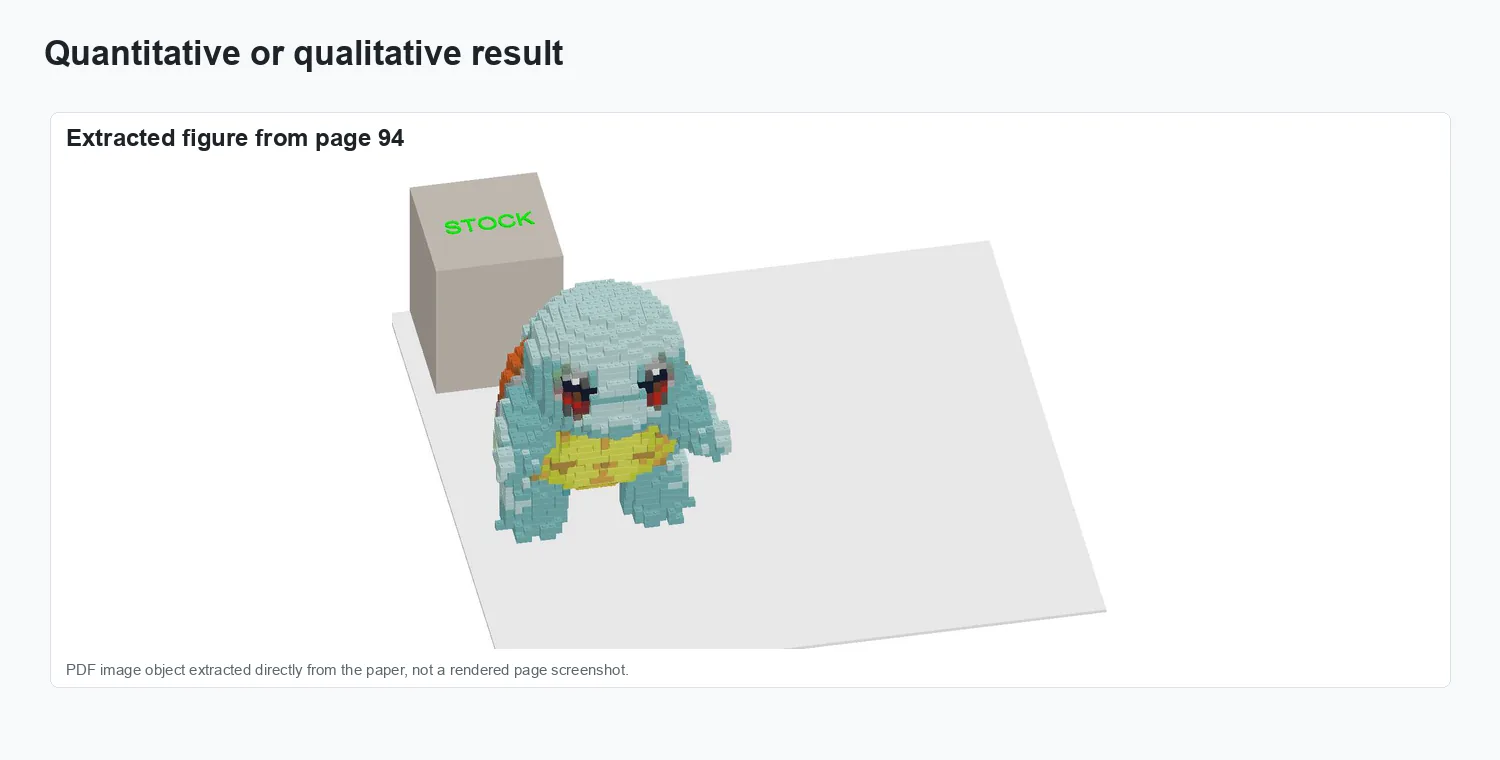
The figures below collect representative visual evidence from the thesis, including model transformation examples and assembly-sequence results.
Method and visual evidence
The figures below summarize the paper’s workflow and representative visual evidence.
Method overview.
Representation and setup.
Experimental evidence.
Result comparison.
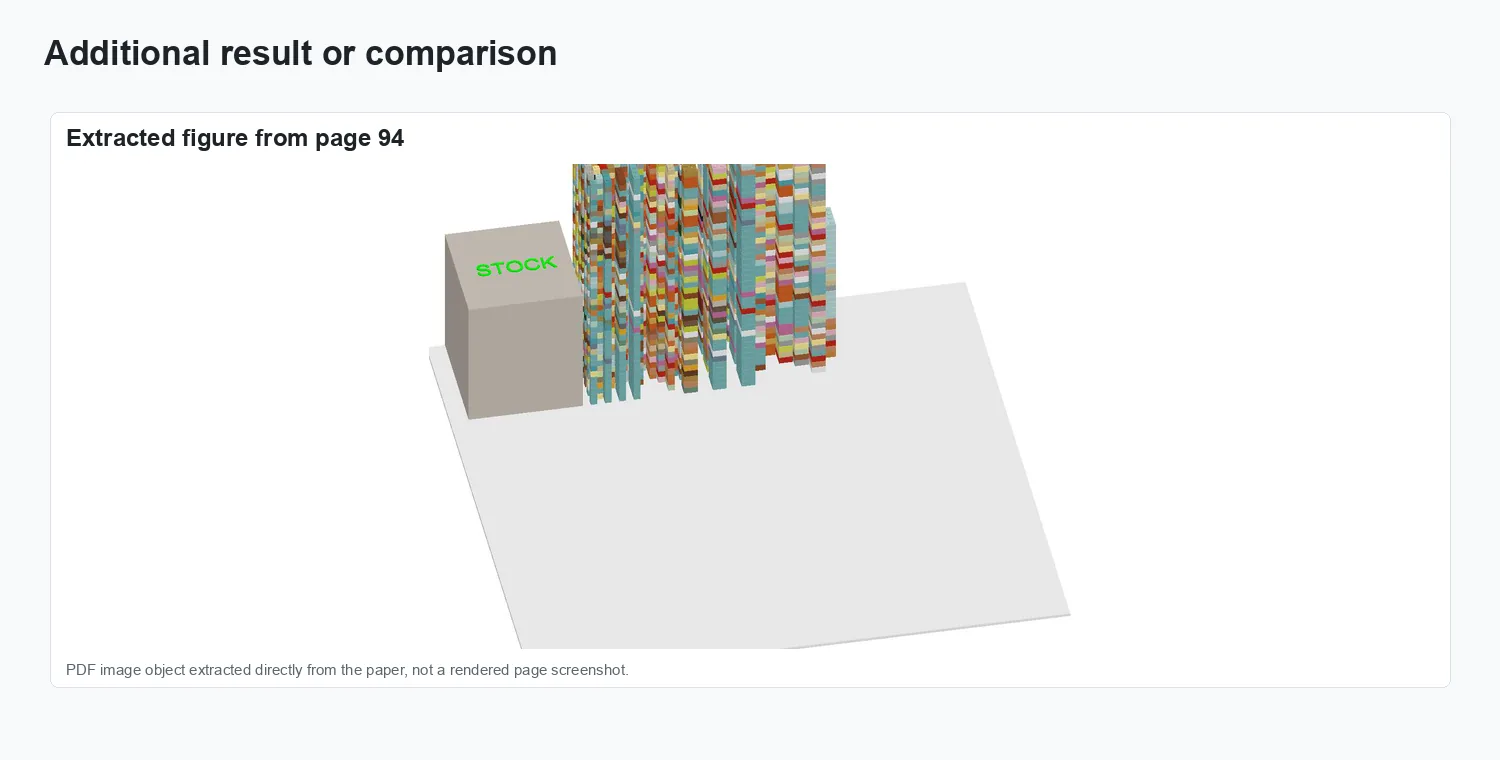
Additional visual result.
Results and impact
The evaluation reported in Singapore University of Technology and Design is summarized through the figures above.