Moving Sequence Generation Based on Hungarian Method for Pick-and-Place Process
This paper presents a method for generating optimal moving sequences in pick-and-place robotic processes using the Hungarian method, formulated as an assignment problem to minimize total travel cost in automated assembly tasks. This early conference paper established the core algorithmic contribution that was later extended to the full journal publication on PnP process sequencing for 3D rasterized structures (Automation in Construction, 2017).
Problem setting
This paper presents a method for generating optimal moving sequences in pick-and-place robotic processes using the Hungarian method, formulated as an assignment problem to minimize total travel cost in automated assembly tasks.
The figures below collect representative visual evidence from CAD'15, 47–52.
Method and visual evidence
The figures below summarize the paper’s workflow and representative visual evidence.
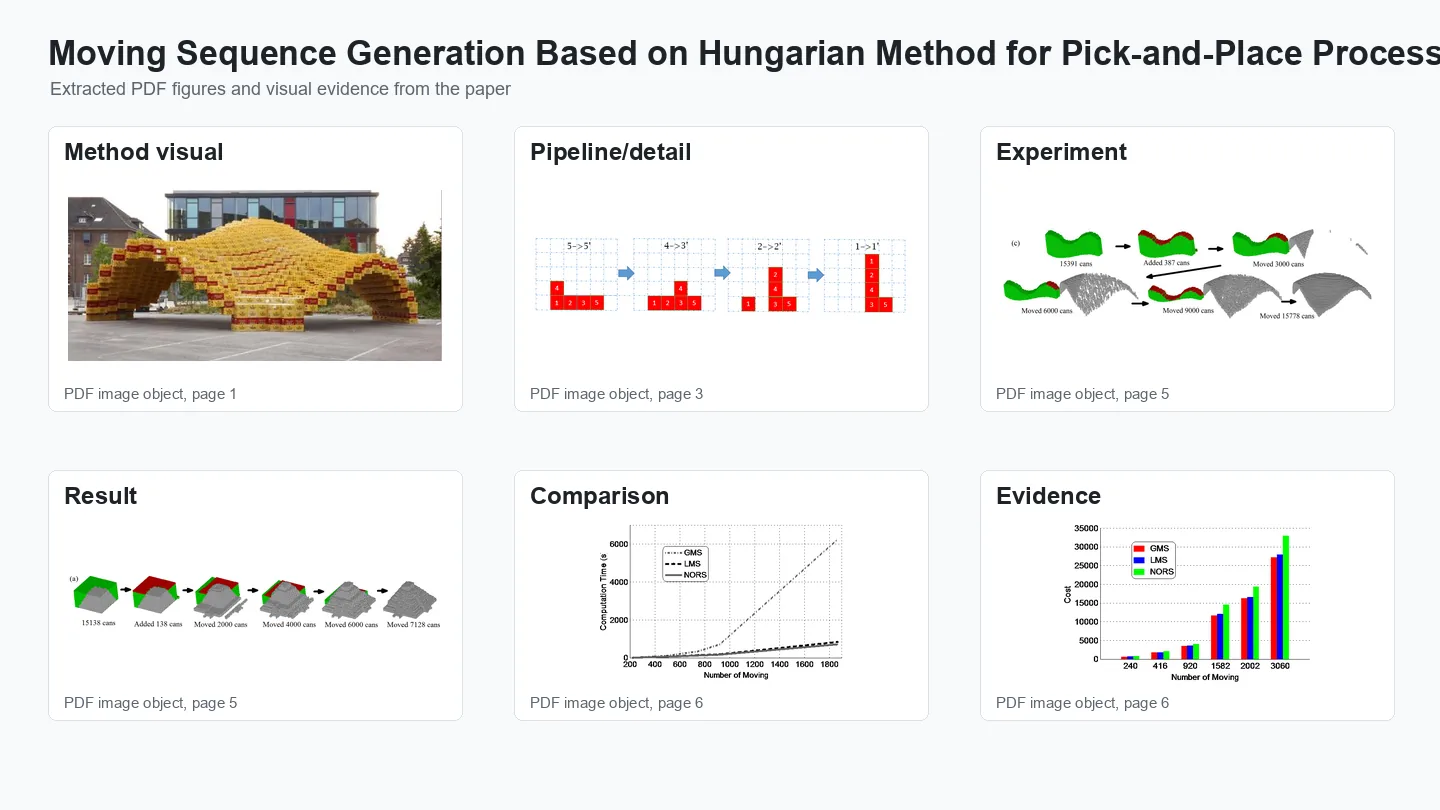
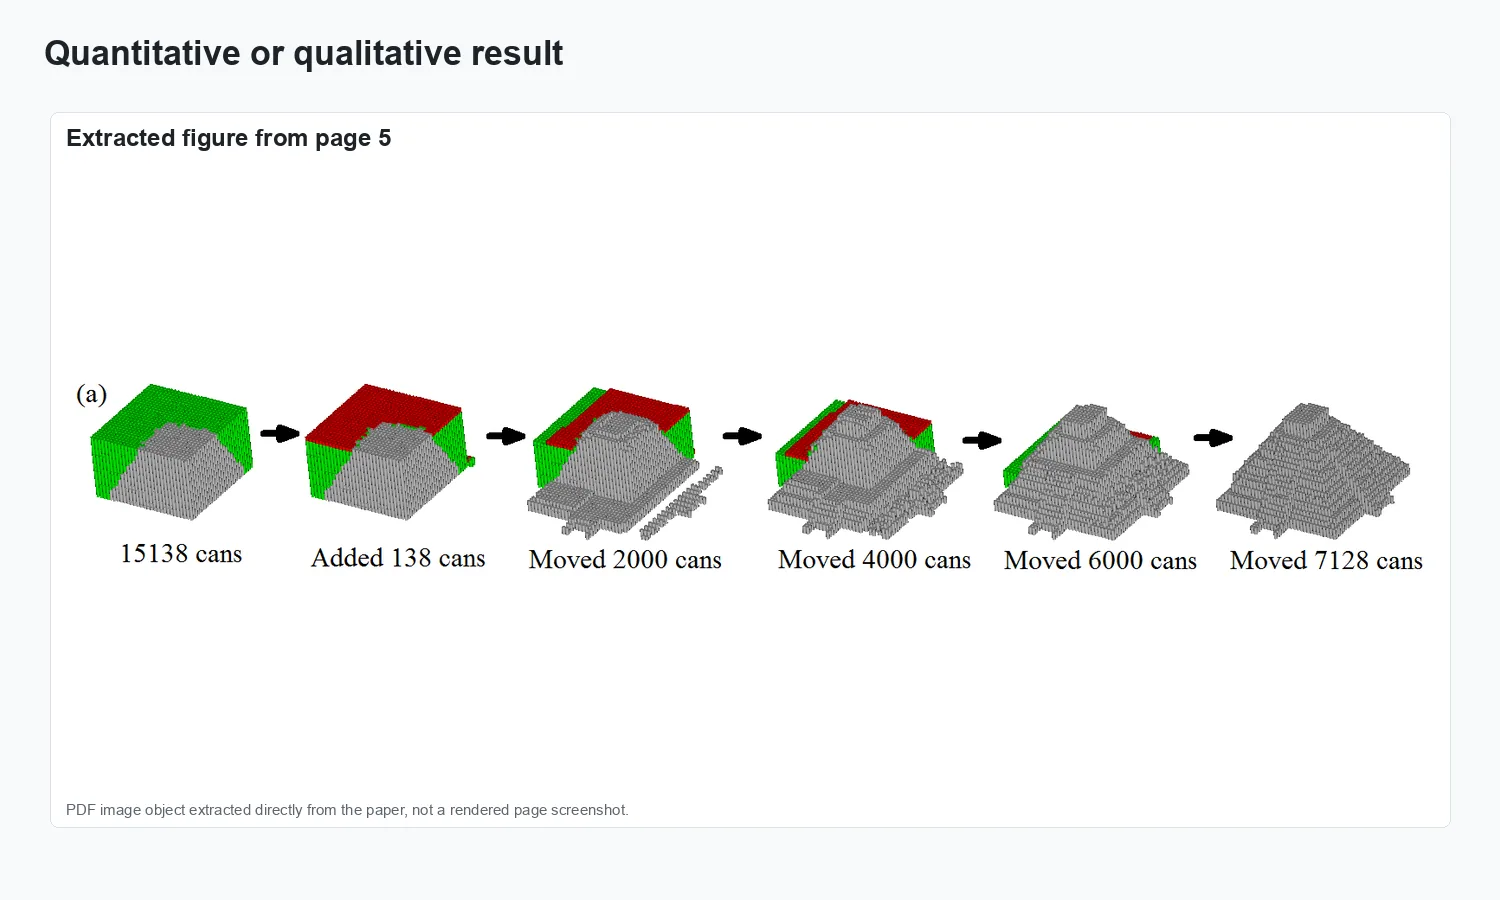
Method overview.
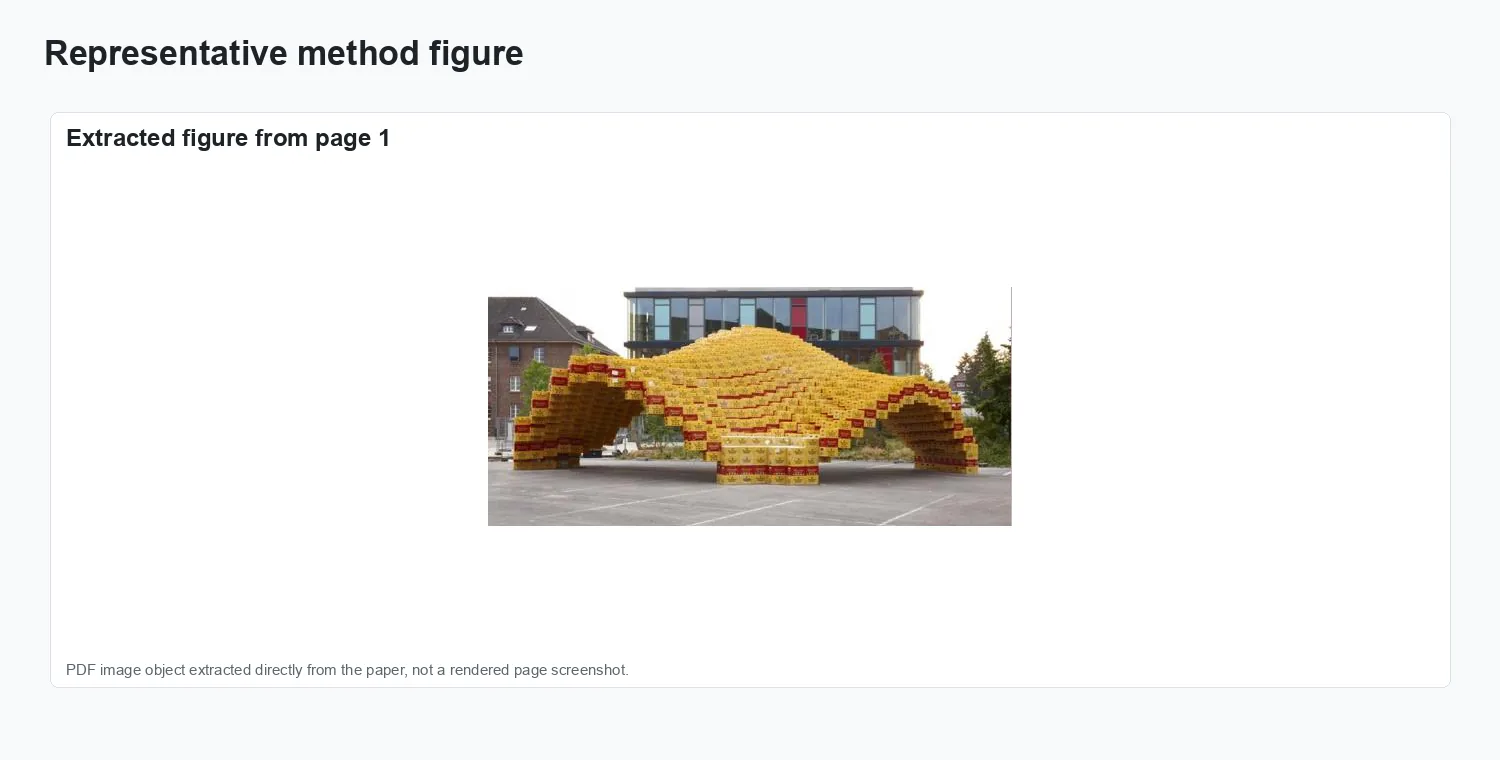
Representation and setup.
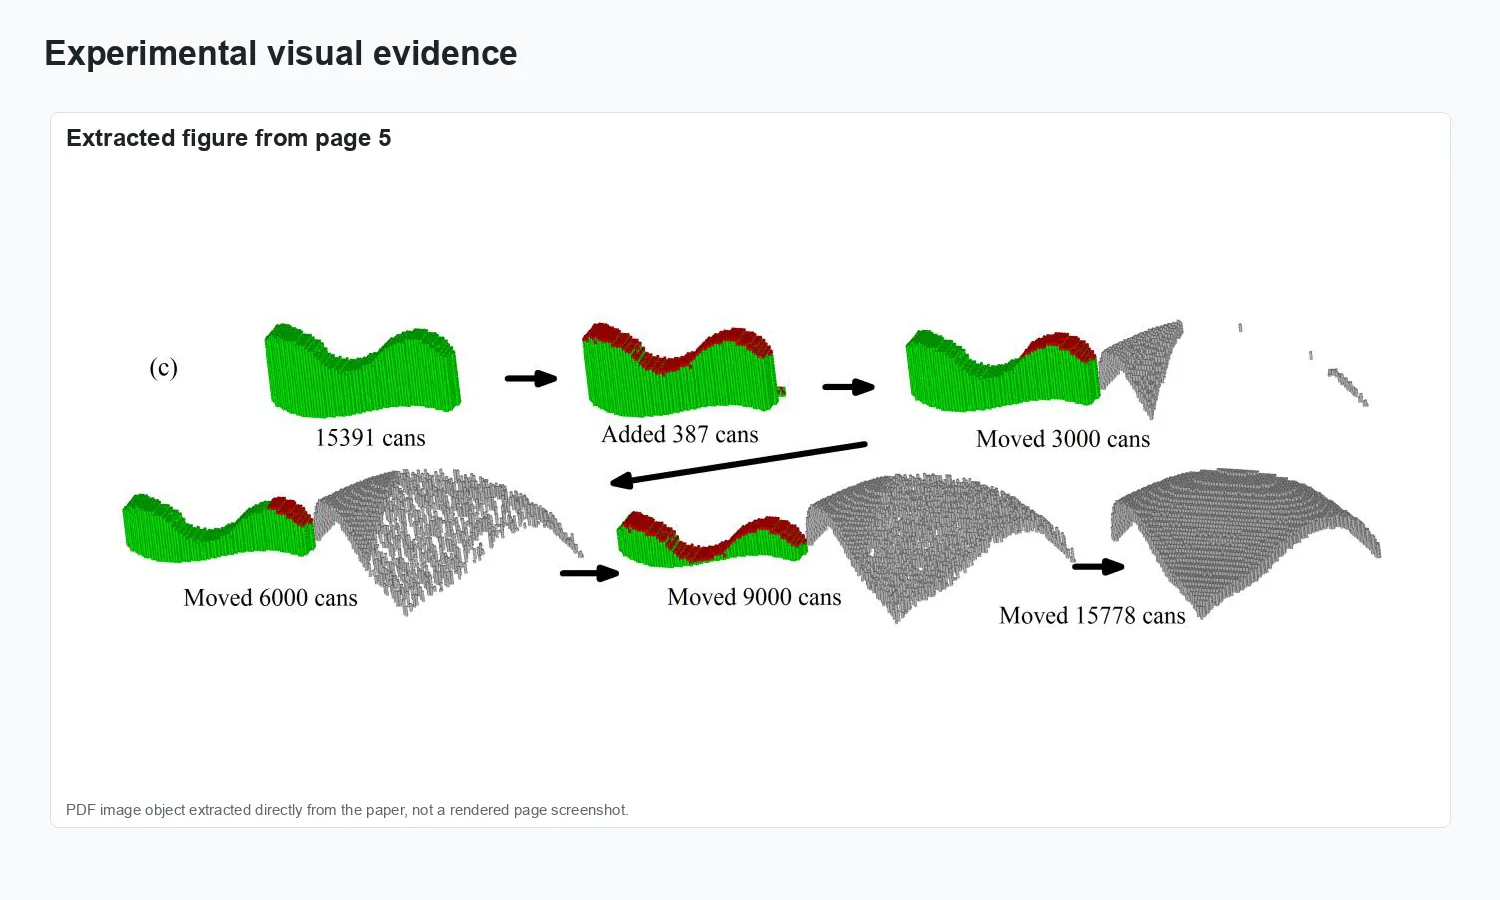
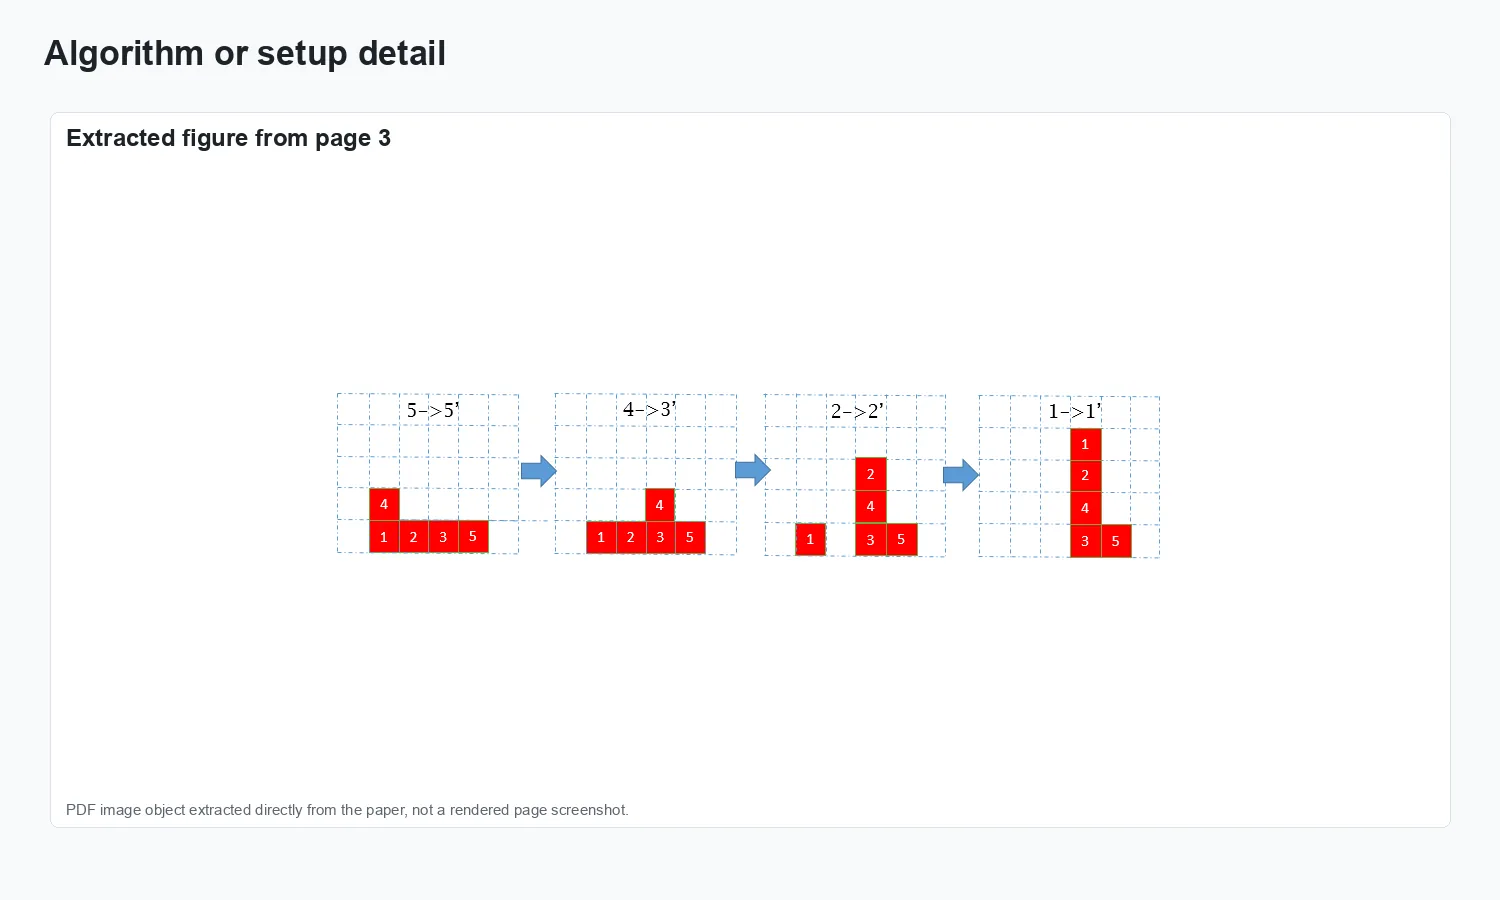
Experimental evidence.
Result comparison.
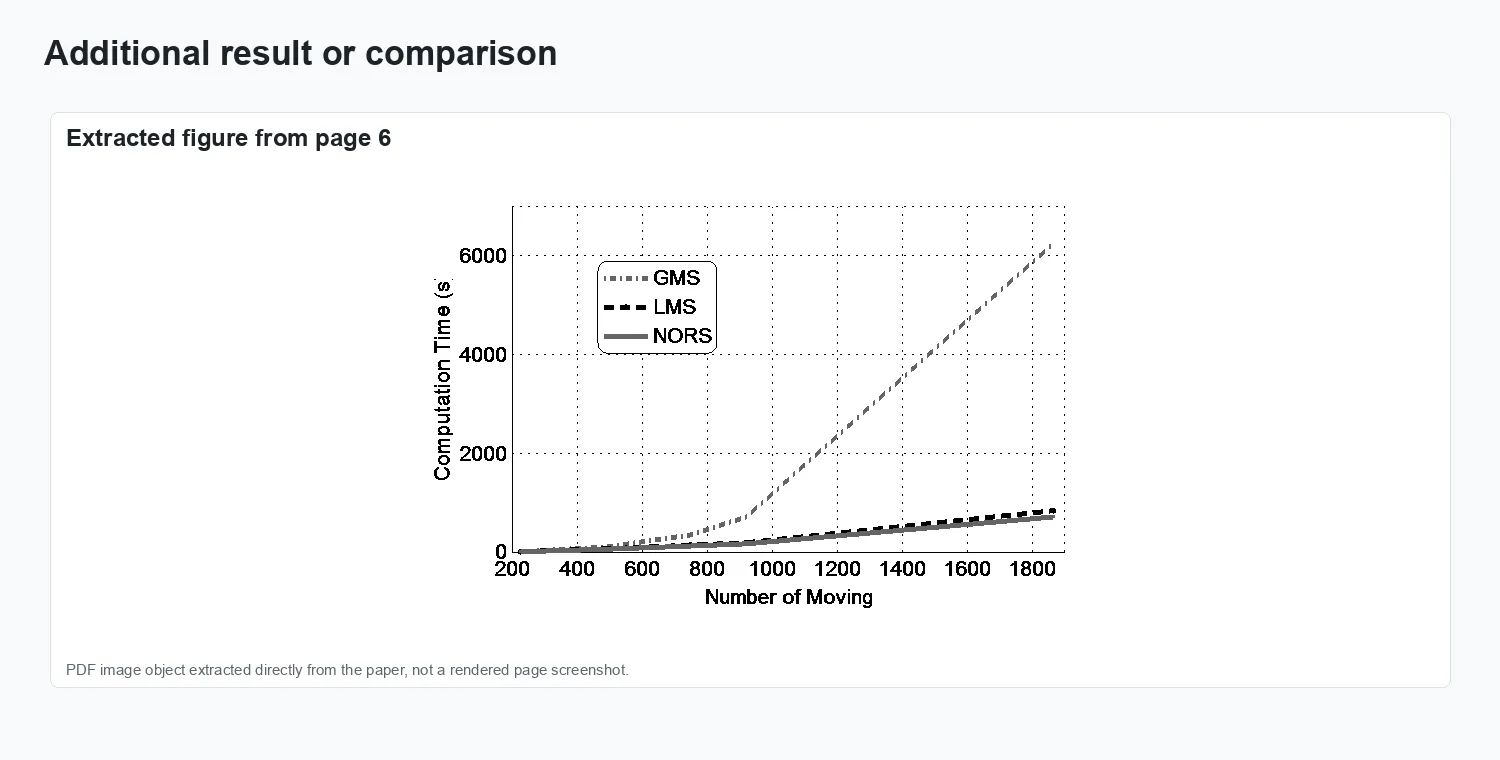
Additional visual result.
Results and impact
The evaluation reported in CAD'15, 47–52 is summarized through the figures above.