Photometric stereo-based defect detection for lithium battery top covers

Detecting surface defects on lithium battery top covers is critical for ensuring their performance, reliability, and longevity. Photometric stereo (PS) methods, known for their ability to capture detailed surface topography with high precision and speed, have been widely applied in industrial defect detection. However, these methods often face challenges in dynamic scenes with varying lighting conditions and in detecting subtle defects such as shallow scratches. To address these limitations, we propose an enhanced approach that combines the advantages of photometric stereo with a line-scan camera and weighted least squares filtering.
This work appears in Seventh International Conference on Image Processing and Machine Vision (IPMV 2025), vol. 13636, 100-107.
Problem setting
Detecting surface defects on lithium battery top covers is critical for ensuring their performance, reliability, and longevity. Photometric stereo (PS) methods, known for their ability to capture detailed surface topography with high precision and speed, have been widely applied in industrial defect detection. However, these methods often face challenges in dynamic scenes with varying lighting conditions and in detecting subtle defects such as shallow scratches.
The figures below collect representative visual evidence from Seventh International Conference on Image Processing and Machine Vision (IPMV 2025), vol. 13636, 100-107.
Method and visual evidence
The figures below summarize the paper’s workflow and representative visual evidence.
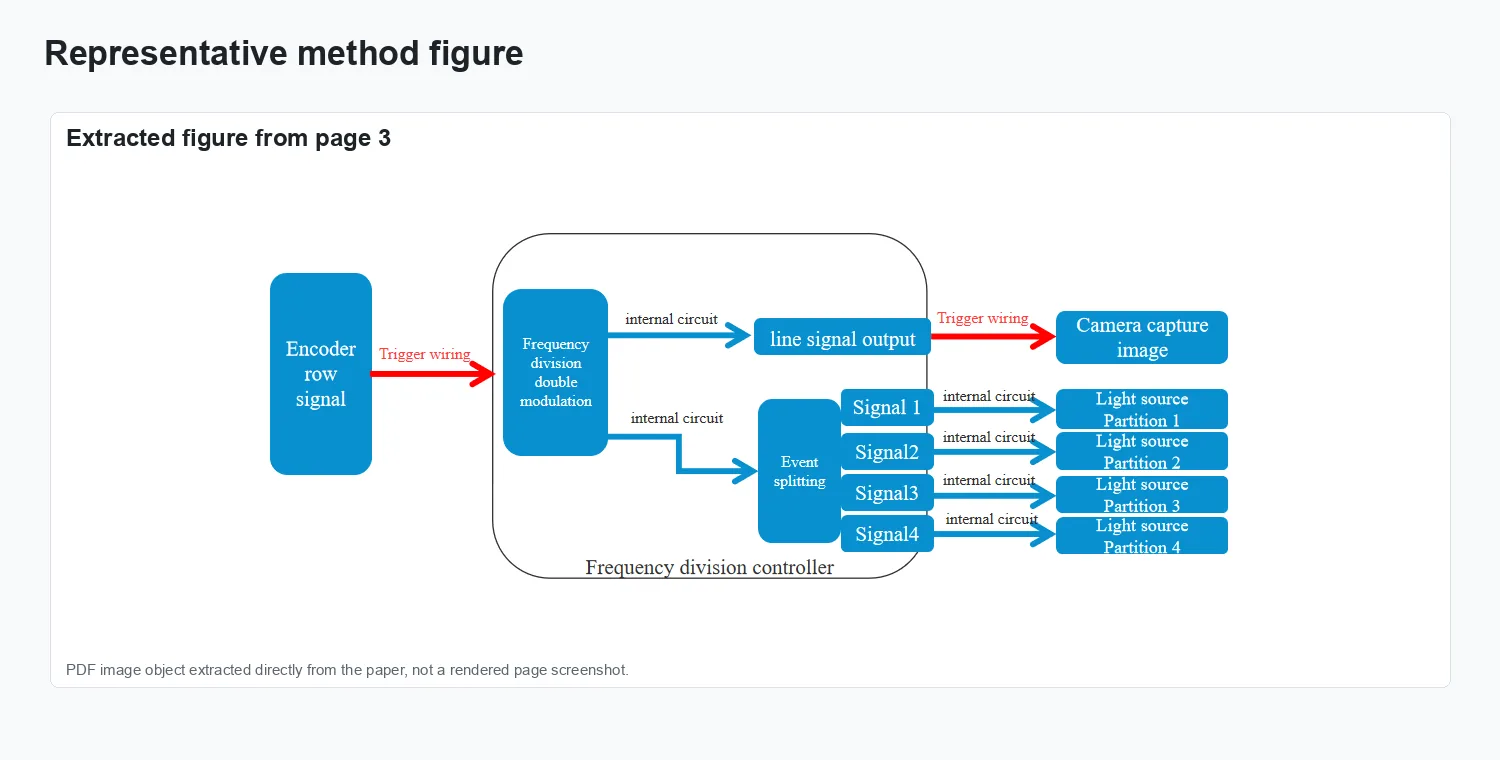
Method overview.

Representation and setup.

Experimental evidence.

Result comparison.

Additional visual result.
Results and impact
The evaluation reported in Seventh International Conference on Image Processing and Machine Vision (IPMV 2025), vol. 13636, 100-107 is summarized through the figures above.