Physically inspired geometry-to-photometry rendering and lightweight convolutional neural network for real-time weld defect detection
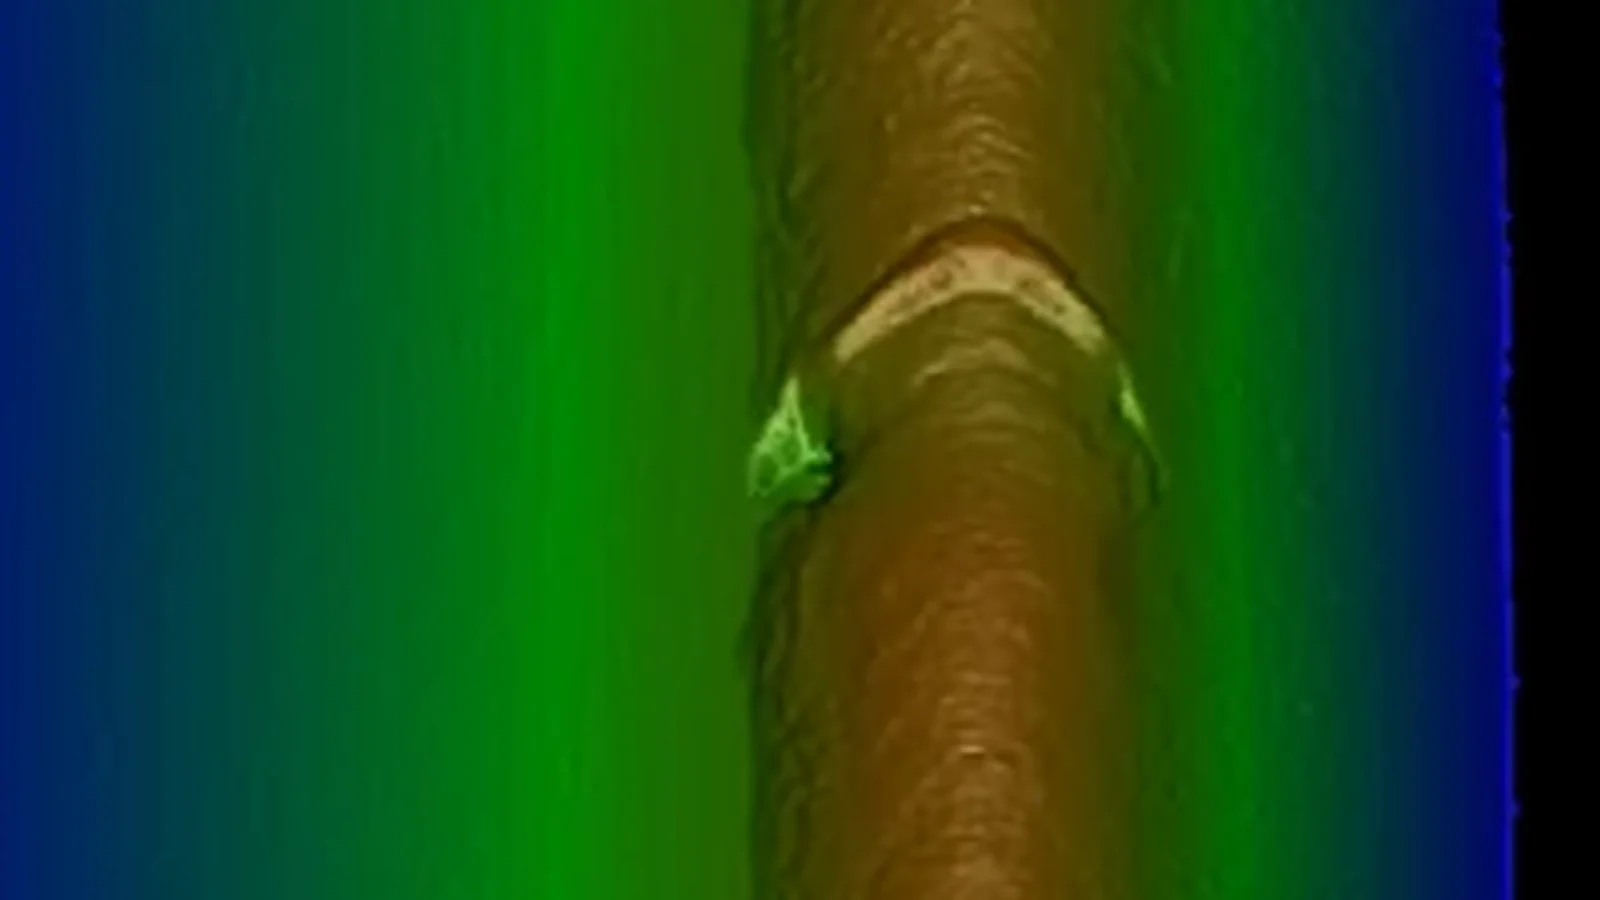
In one sentenceWeld defects on battery top covers are only sub-millimetre bumps and pits. The method renders the 3D depth map with Phong shading so these small height changes become strong brightness contrast, then finds them with a 2.47M-parameter YOLO network: 93.8% mAP@50 on six defect types.
The problem
The weld seam on a lithium-ion battery top cover decides how well the cell is sealed, and defects in it can lead to electrolyte leakage or thermal runaway. Inspecting it automatically is hard for three reasons, according to the authors. The height difference between a defect and the sound weld is only sub-millimetre, and on a reflective, weakly textured metal surface it produces no stable brightness contrast, so an ordinary 2D camera image carries almost no usable defect signal. A 3D scanner does record the deviation, but point-cloud networks are too slow and heavy for a production line. And when the depth map is fed directly to a 2D convolutional network, the network sees a scalar grey-level field in which tiny defects are easily overlooked.
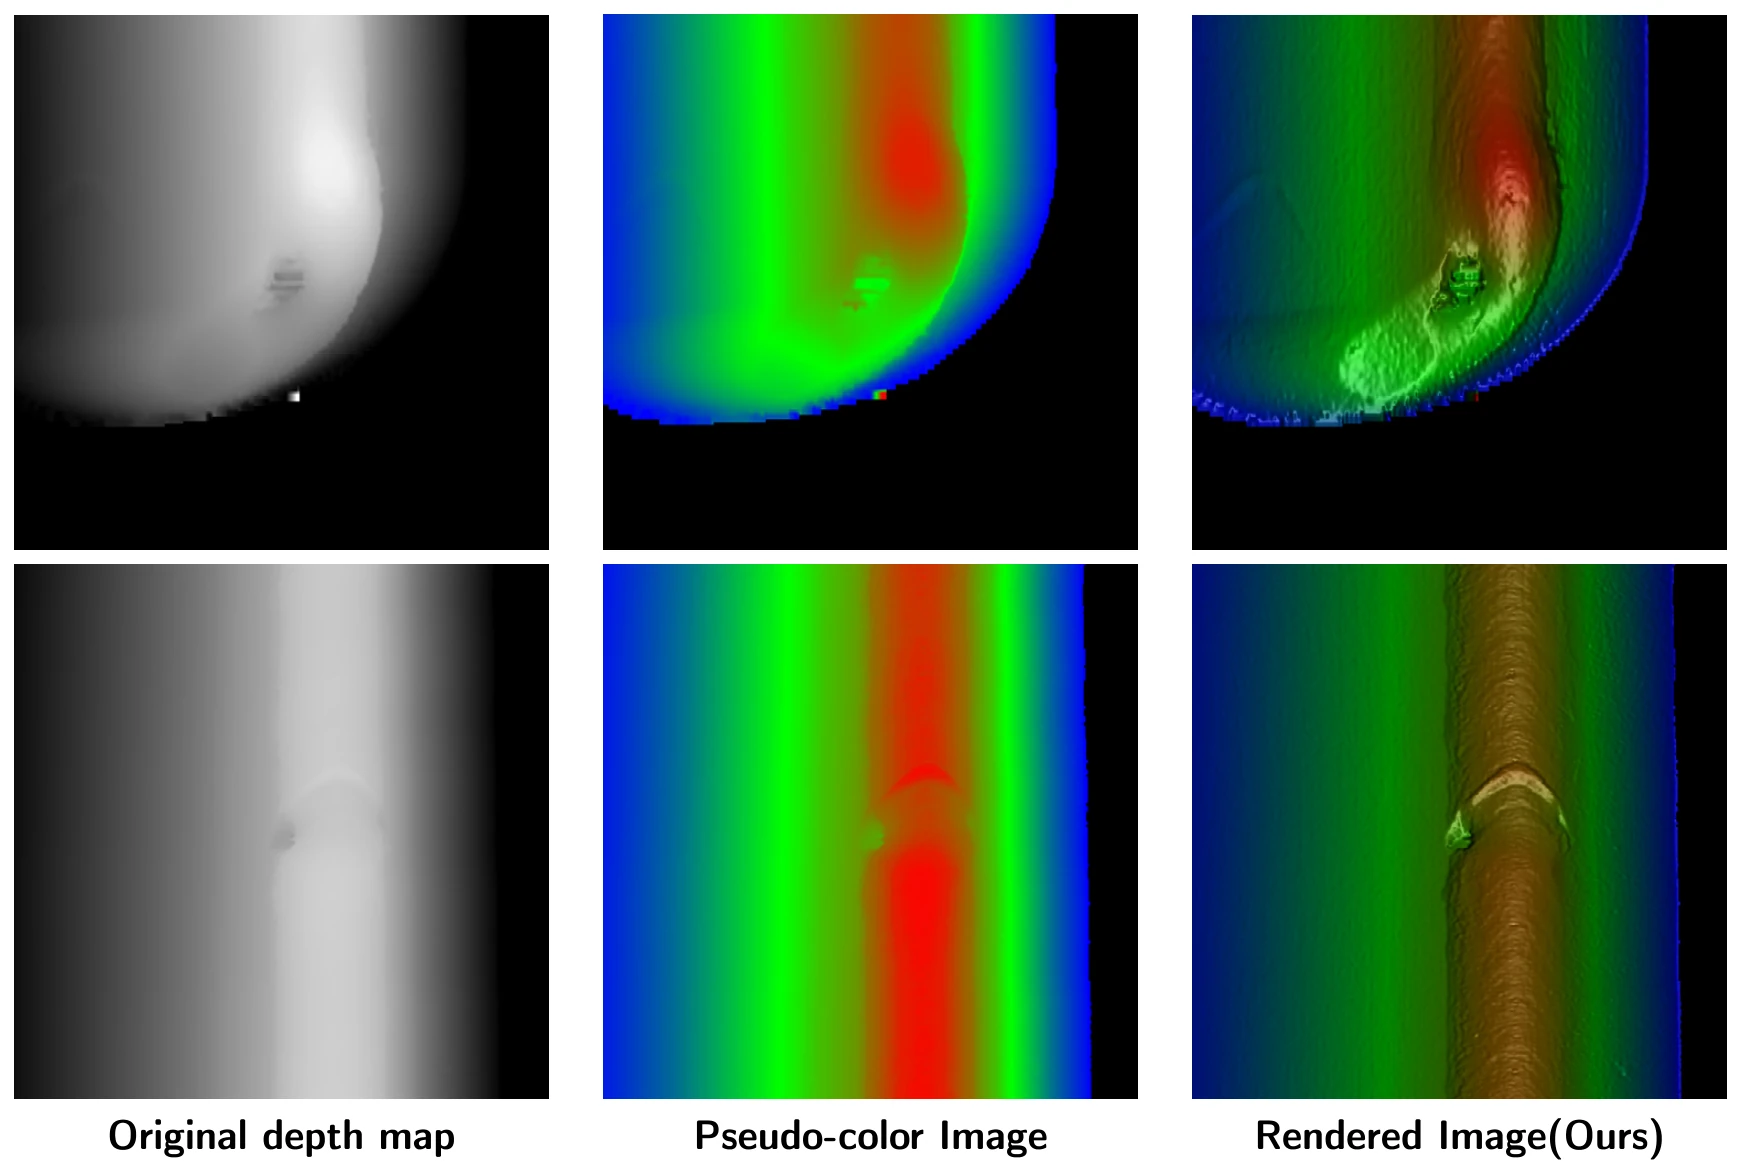
The paper therefore keeps the 3D measurement but changes how it is shown to the detector. A deterministic, physically interpretable rendering turns the depth map into a colour image in which small geometric changes become strong photometric contrast, and a lightweight 2D detector then works on that image. No multi-sensor fusion or point-cloud processing is needed at inference.
How it works
The framework has two stages (Fig. 1 of the paper): depth-normal guided illumination rendering, and detection with a network the authors call YOLO-WaveletTiny (YOLO-WT).
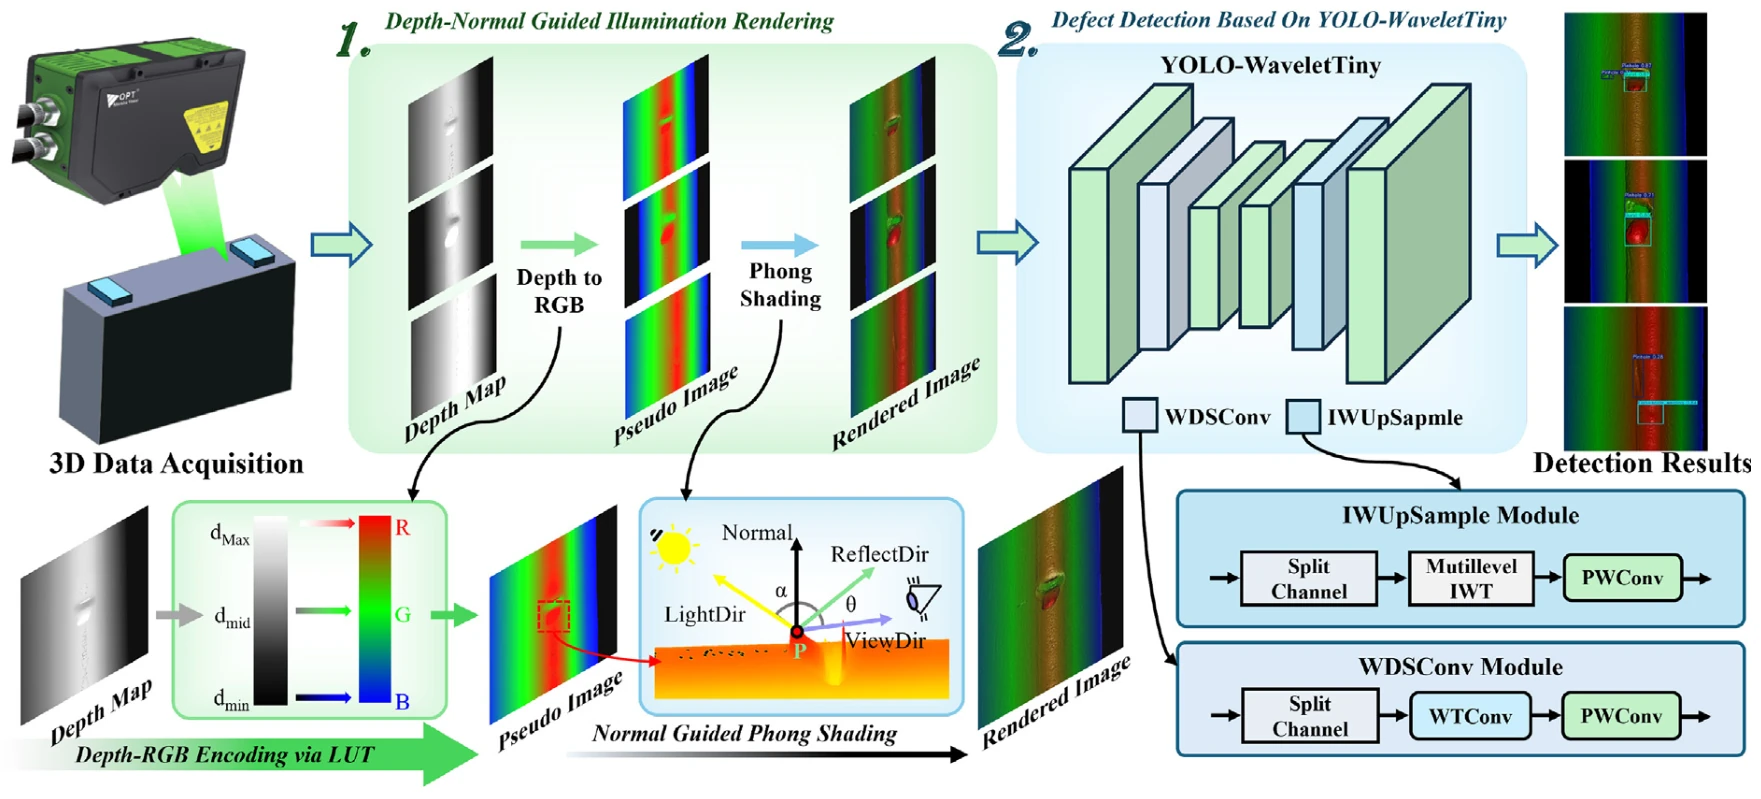
- Depth acquisition. A 3D line-laser profile scanner (OPT-LPC61) scans the weld and produces a single-view depth map. No multi-view registration or fusion is used anywhere in the experiments.
- Depth-to-RGB mapping. Instead of a fixed colour map, the lookup table is built from the statistics of each depth map. The histogram bin width comes from the Freedman–Diaconis rule, h = 2·IQR / ∛N. The cumulative distribution of the histogram is scaled to the index range 0–255, and a segmented RGB gradient turns each index into a colour. This pseudo-colour image carries the global depth hierarchy of the weld.
- Surface normals. For each pixel, two diagonal vectors to its neighbours are formed and their cross product, normalised, gives the surface normal. On a sound weld the normals are consistent; at pits and bumps they change abruptly.
- Phong shading. The normals drive a Phong model: ambient, diffuse (N·L) and specular ((R·V)ⁿ) terms are summed into an intensity I, and the rendered image is I times the pseudo-colour image. Because the result depends on the dot products of the normals, small normal perturbations from micro-defects cause large intensity changes. The rendering runs in C++ with OpenCV; its parameters (Table 3 of the paper) are empirical, for example ambient weight 0.1, diffuse 0.5, specular 0.3 and highlight index 32.
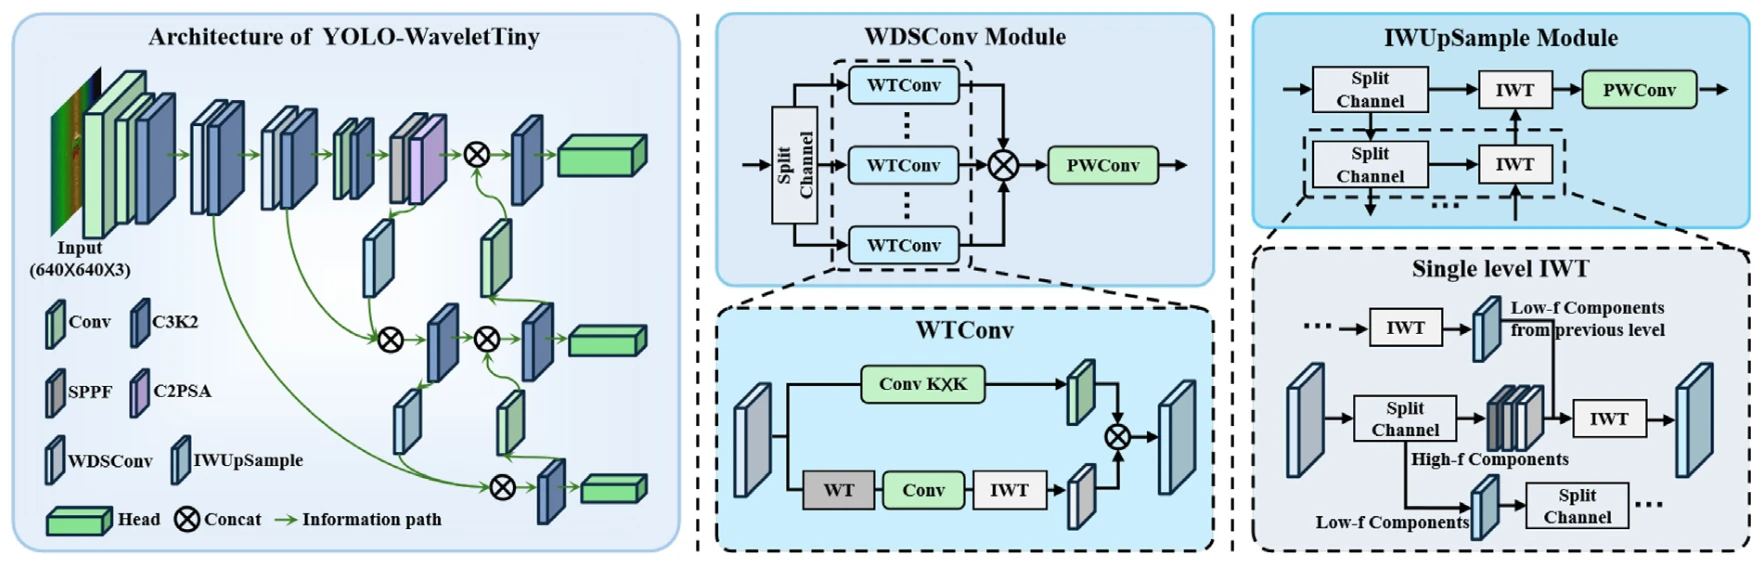
- YOLO-WaveletTiny. The detector starts from YOLOv11n and adds two wavelet modules. WDSConv in the backbone replaces the 3×3 depthwise convolution with a Haar wavelet split into one low-frequency and three high-frequency subbands, filters each subband with a depthwise convolution, reconstructs by inverse wavelet transform and projects with a 1×1 convolution. IWUpsample in the neck replaces interpolation-based upsampling with a multi-level inverse wavelet reconstruction, so that fine high-frequency defect detail is not blurred during feature fusion.
Results
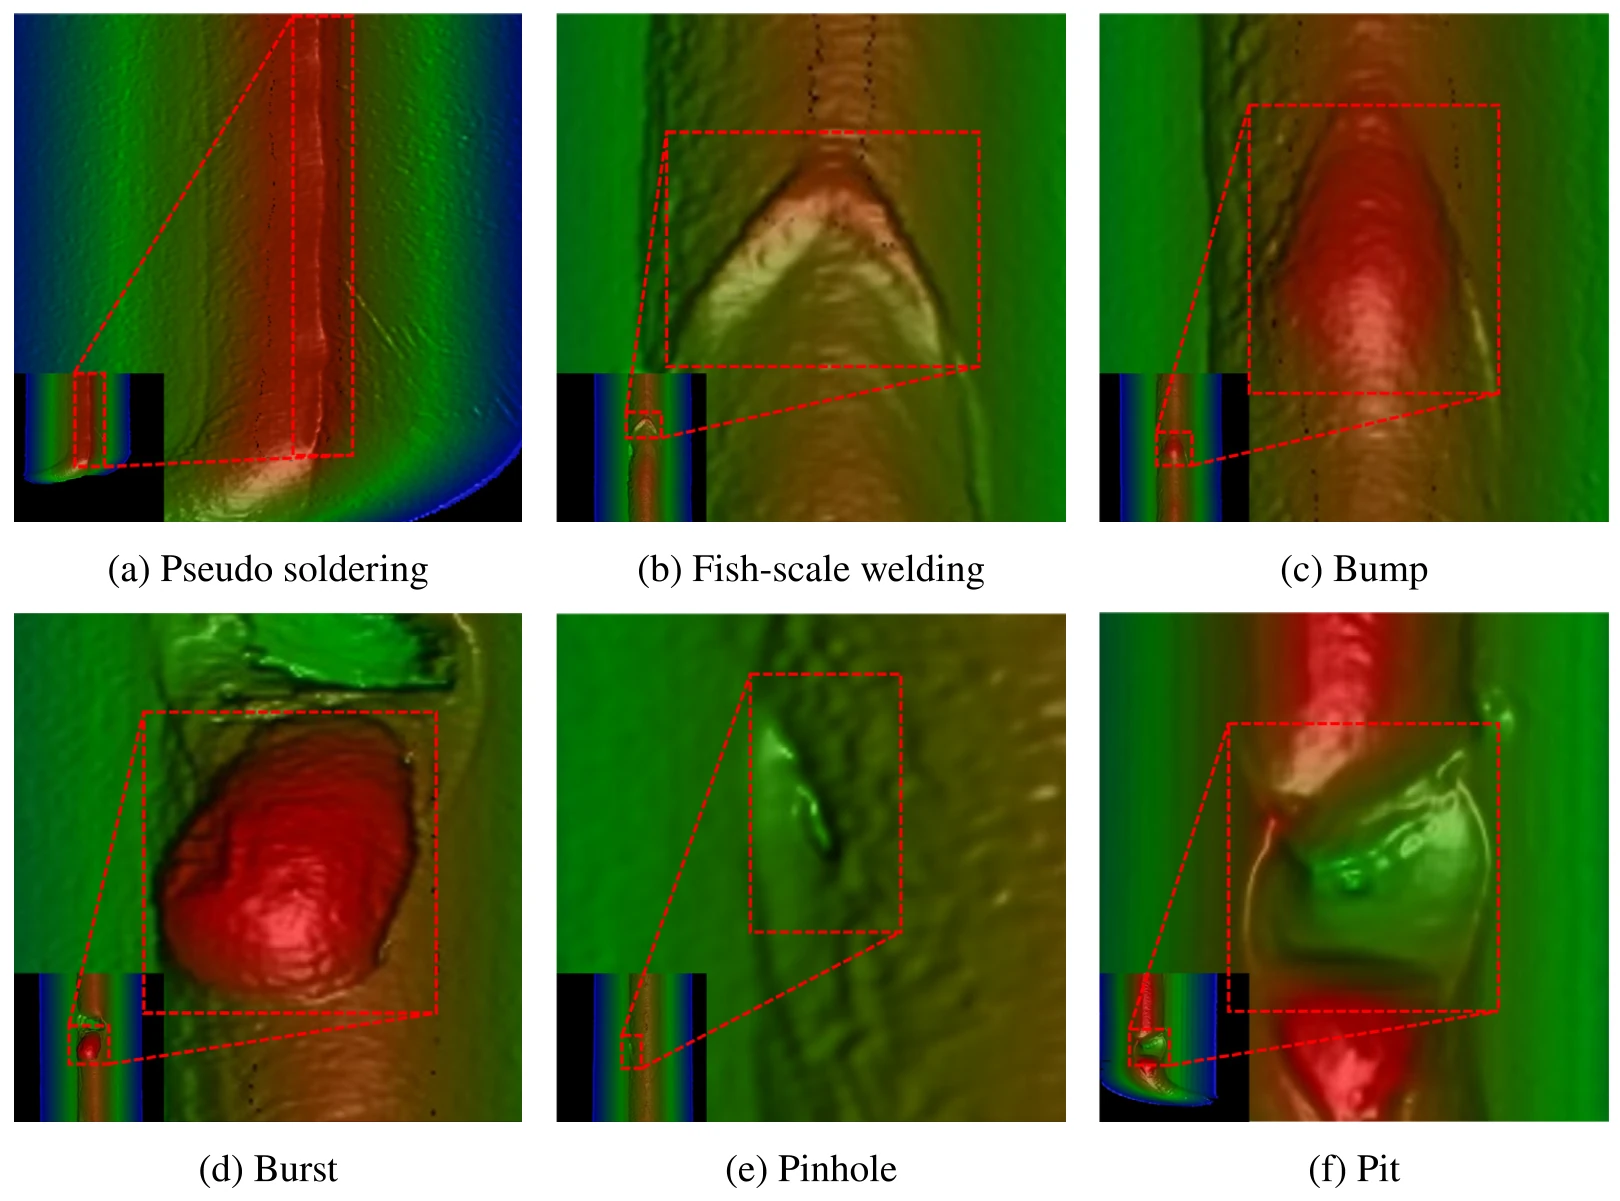
The dataset comes from real production inspection of automotive battery top cover welds and holds six defect classes, from 104 bumps to 381 pinholes, so the classes are clearly imbalanced (Table 2). Each sample is a single-view depth map, cropped to 640 × 640 pixels and split 8:1:1 into training, validation and test sets. Training uses 250 epochs, SGD and no pretrained weights; detection runs on an RTX 3080.
Why the rendering helps. The paper first measures how well each representation separates defect from background (Table 5). The rendered image has the highest edge gradient gain (4.130), but not every metric: the pseudo-colour image has the largest mean intensity contrast (0.064) and the specular component alone has the highest signal-to-noise ratio (1.557). The rendered image combines these with 0.051 and 0.771. A second analysis correlates, over 16 × 16 pixel patches, how much the normals vary with the local Michelson contrast (Table 6). Here the rendered image correlates most strongly of all modalities (Pearson 0.489, Spearman 0.737, Kendall 0.557), while the pseudo-colour image barely correlates (Pearson 0.121).
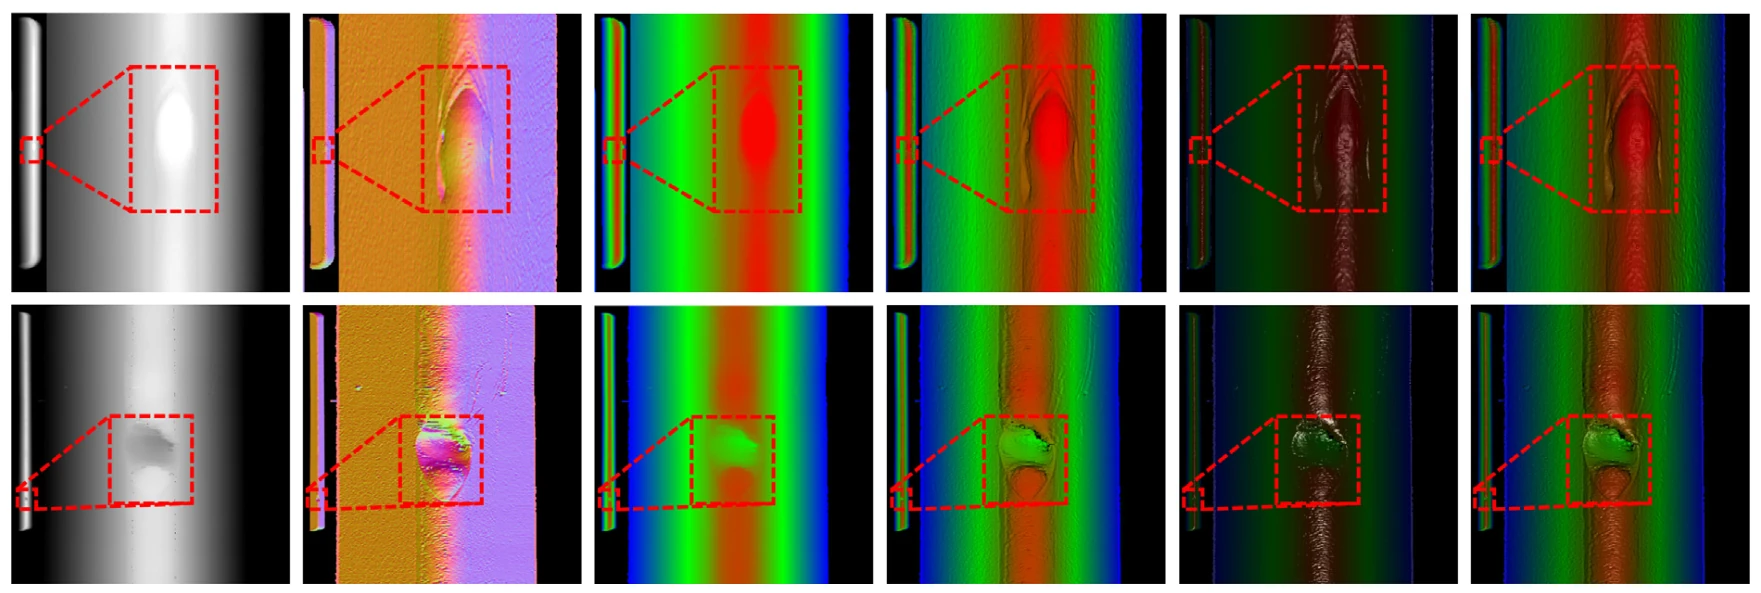
A Morris sensitivity analysis over the six rendering parameters shows that the ambient weight and the light direction dominate all three visibility metrics, while the diffuse weight and highlight index have weak, stable effects and can be left at typical values (Table 7). Under added Gaussian noise, pulse noise and random occlusion of the depth map, intensity contrast and SNR fall gradually. Under occlusion the edge gain rises artificially, because the missing blocks create spurious edges; the authors conclude that occluded scans need hole filling before edge-based analysis.
Choice of shading model. Six classical models were compared with the same YOLOv11n detector (Table 9). Phong and Blinn-Phong tie at 91.0% mAP@50, and Phong has the best precision (90.3%, tied with Gooch) with recall of 87.3%. Minnaert is marginally higher on mAP@50-95 (46.5% against 46.3%) and Rim Lighting on recall (88.2%). Phong is also the slowest of the six on CPU, at 15.2 ms per image; the authors consider this acceptable given the cost of missed defects.
The detector. In the ablation (Table 10), IWUpsample alone raises mAP@50 from 91.0% to 93.2% at slightly higher cost, while WDSConv alone makes the model smaller (2.45M parameters, 5.6 GFLOPs) but less accurate (90.7%). Together they reach 93.8% mAP@50, 47.6% mAP@50-95 and 88.7% recall, with 4.6% fewer parameters and 10.9% less computation than the baseline. Latency rises from 5.5 ms to 7.3 ms per image, which the authors judge still real-time for the line. Precision drops slightly (89.9% against 90.3%): the model trades a few false alarms for fewer missed defects, which the authors note is usually preferred in inspection. Five-fold cross-validation gives 94.8 ± 1.03% mAP@50 (Table 11).
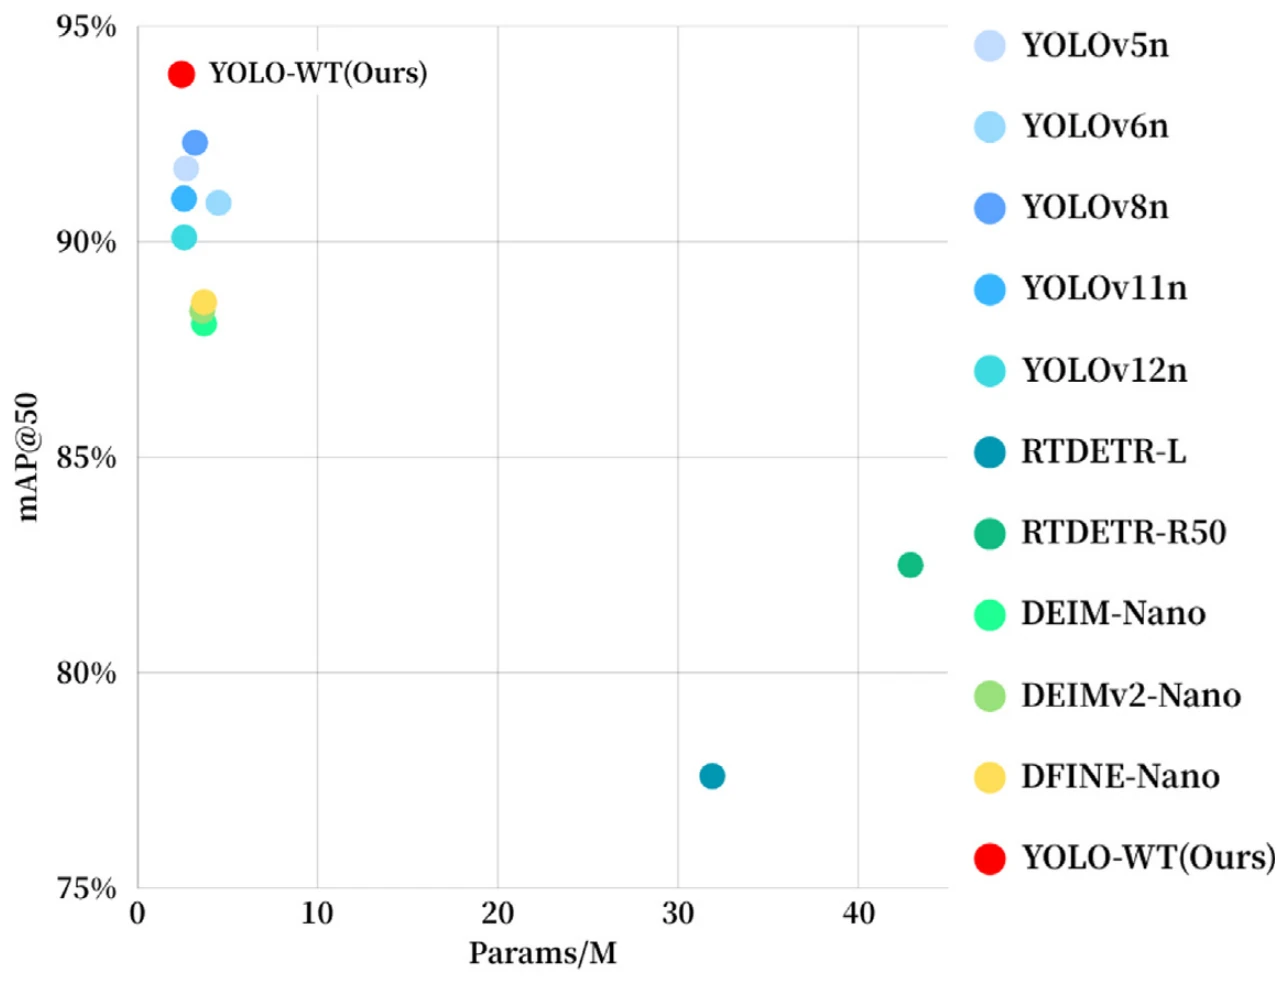
Among the compared 2D detectors (Table 12), YOLOv8n comes second on mAP@50 with 92.3%. On mAP@50-95 YOLO-WT (47.6%) is slightly behind DFINE-Nano (48.6%), DEIM-Nano (48.3%) and DEIMv2-Nano (47.7%), which are larger and slower (3.6–3.7M parameters, 14.9–18.0 ms against 7.3 ms). The authors name three limitations: the rendering parameters are fixed at one operating point, precision is slightly lower in exchange for recall, and the data come from a single production line. Future work is to tune parameters automatically, improve precision, and extend the data to other materials and welding processes.
Cite
@article{cao2026physically,
  title={Physically inspired geometry-to-photometry rendering and lightweight convolutional neural network for real-time weld defect detection},
  author={Cao, Ling and Qiu, Jiajun and Zhang, Yunzhi and Feng, Daquan and Pan, Wei},
  journal={Engineering Applications of Artificial Intelligence},
  volume={185},
  pages={116464},
  year={2026},
  publisher={Elsevier},
  doi={10.1016/j.engappai.2026.116464}
}