Automatic geometric calibration and unwarping of rotating line-scan imaging systems using elliptical distortion of circular patterns
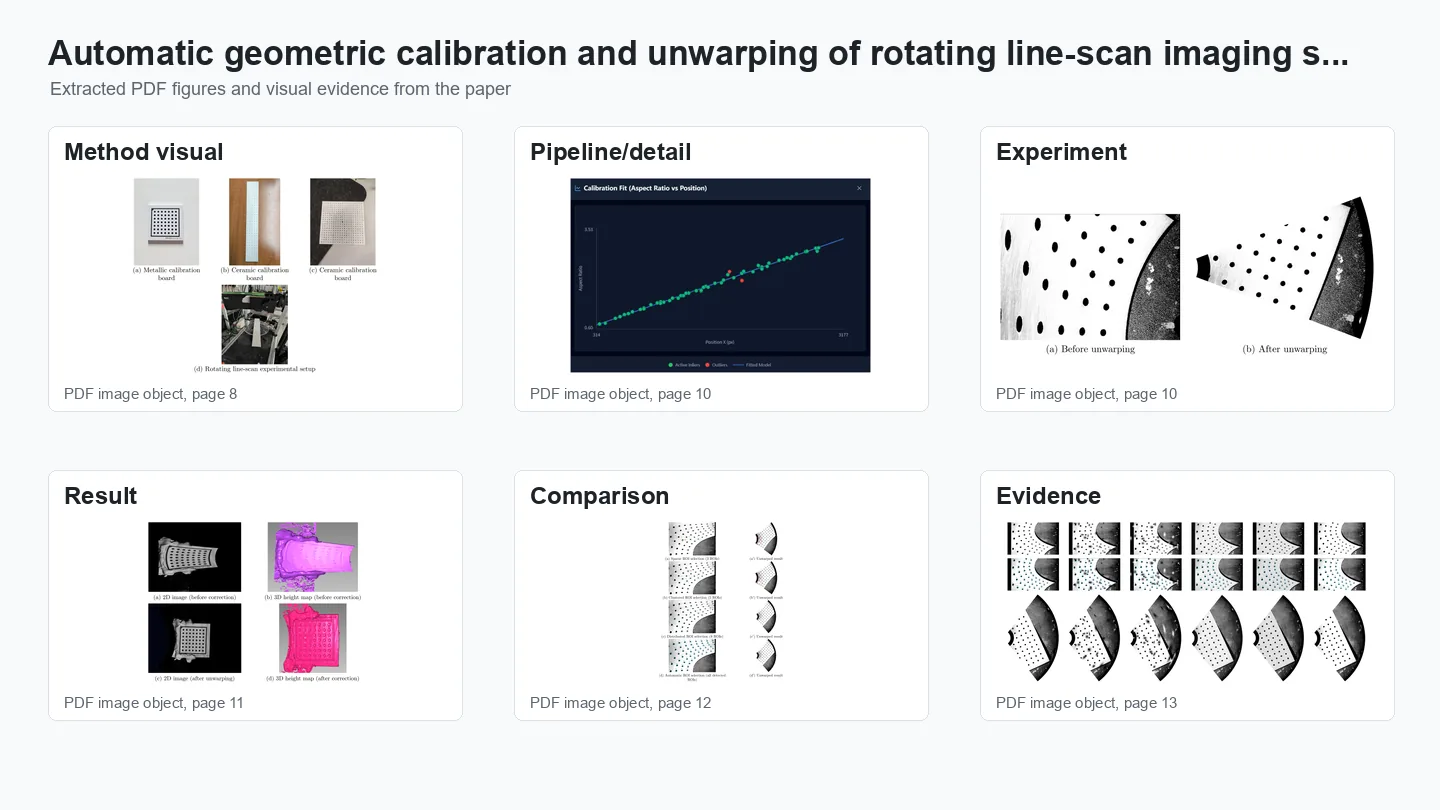
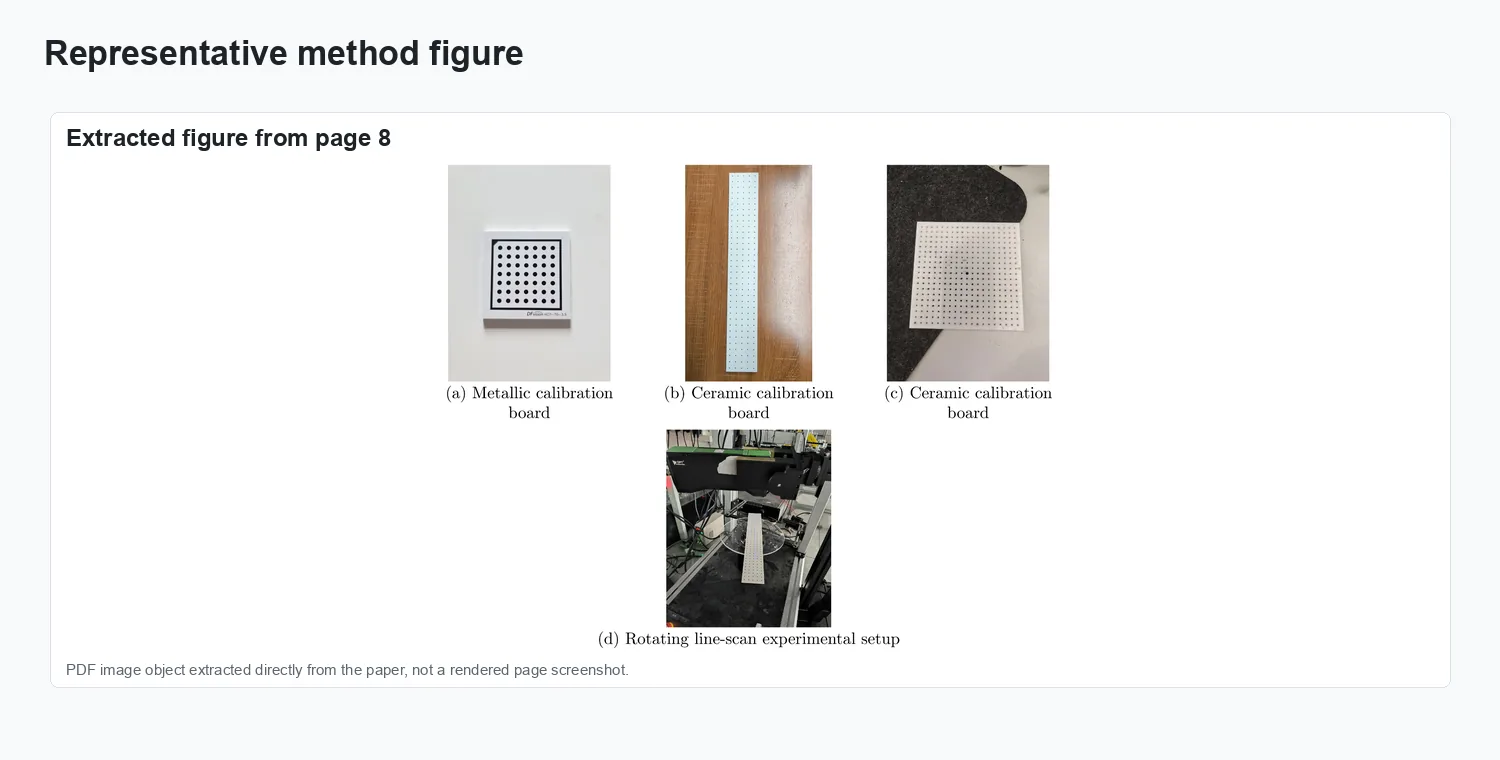
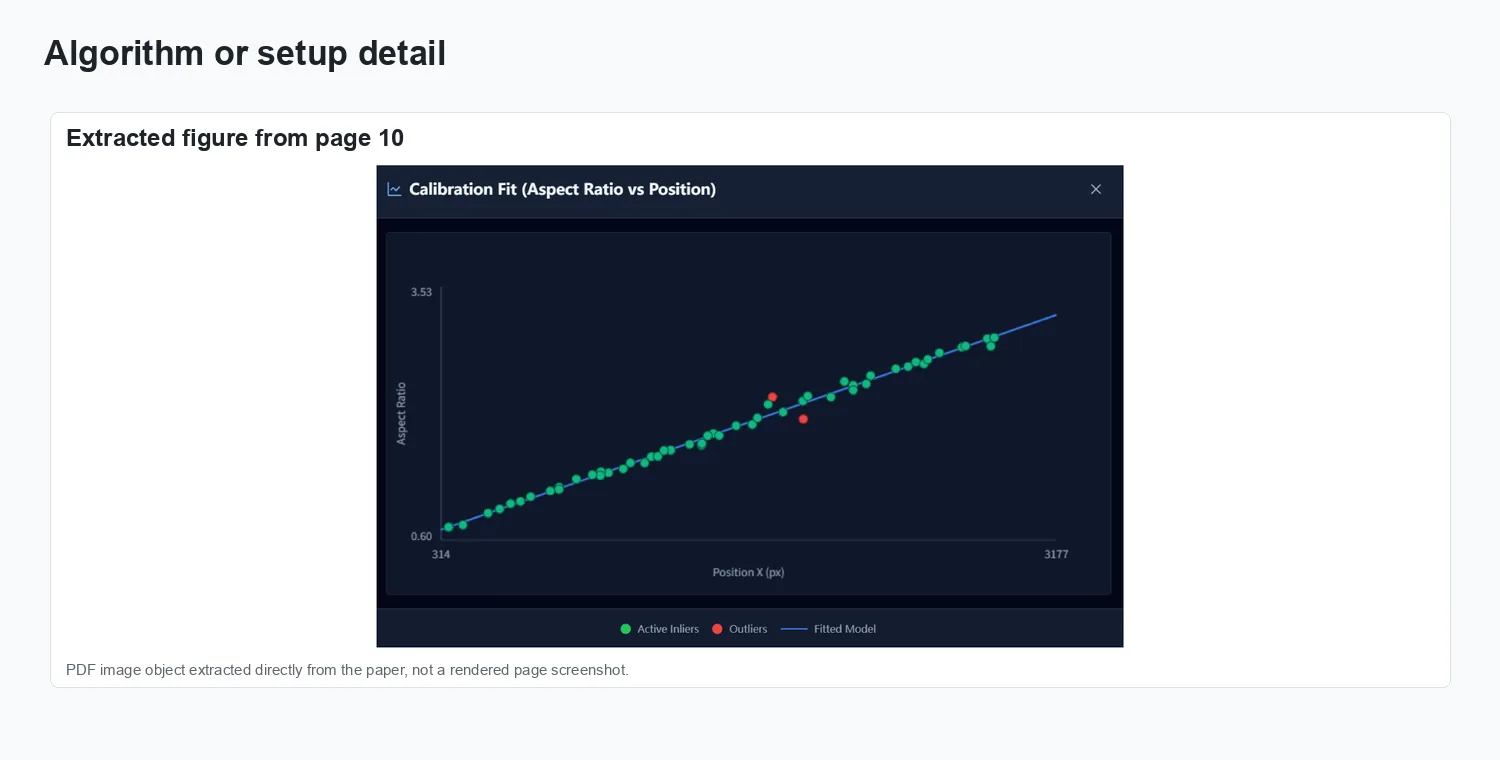
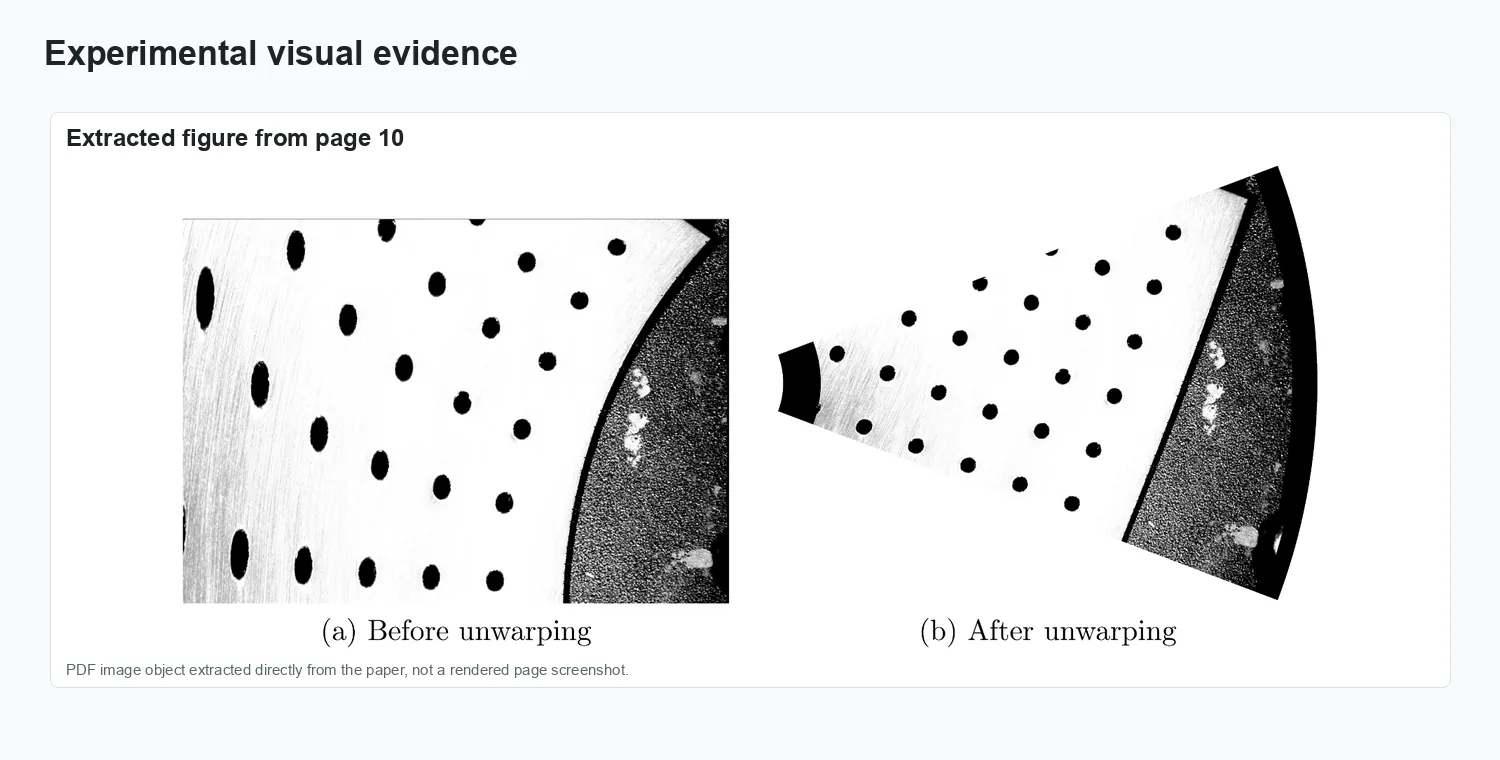
Rotating line-scan cameras and laser profilers acquire a scene line by line while the target or stage rotates. The resulting sector-scan geometry bends both the 2D intensity image and the 3D height map, so circular holes on a calibration plate appear as ellipses rather than circles. This work uses that distortion as the calibration signal: the ellipse centers and aspect ratios reveal the rotation center and angular sampling rate without external encoders or mechanical measurement.
The method is built for practical rotating inspection systems. A single laser profiler captures the 2D intensity image and the 3D height profile under the same sector-scan geometry, and one polar-to-Cartesian correction is then applied consistently to both modalities.
Problem setting
Rotating line-scan cameras and laser profilers operate under a sector-scan geometry, which introduces systematic geometric distortions in both 2D intensity images and 3D line-scan height profiles. This paper presents an image-driven geometric calibration and unwarping framework for such systems using a simple circular-hole calibration plate. Under sector-scan sampling, circular holes are projected as ellipses whose centers and aspect ratios encode the underlying rotation geometry.
The figures below collect representative visual evidence from Optics and Lasers in Engineering, 203:109793.
Method and visual evidence
The figures below summarize the paper’s workflow and representative visual evidence.
Method overview.
Representation and setup.
Experimental evidence.
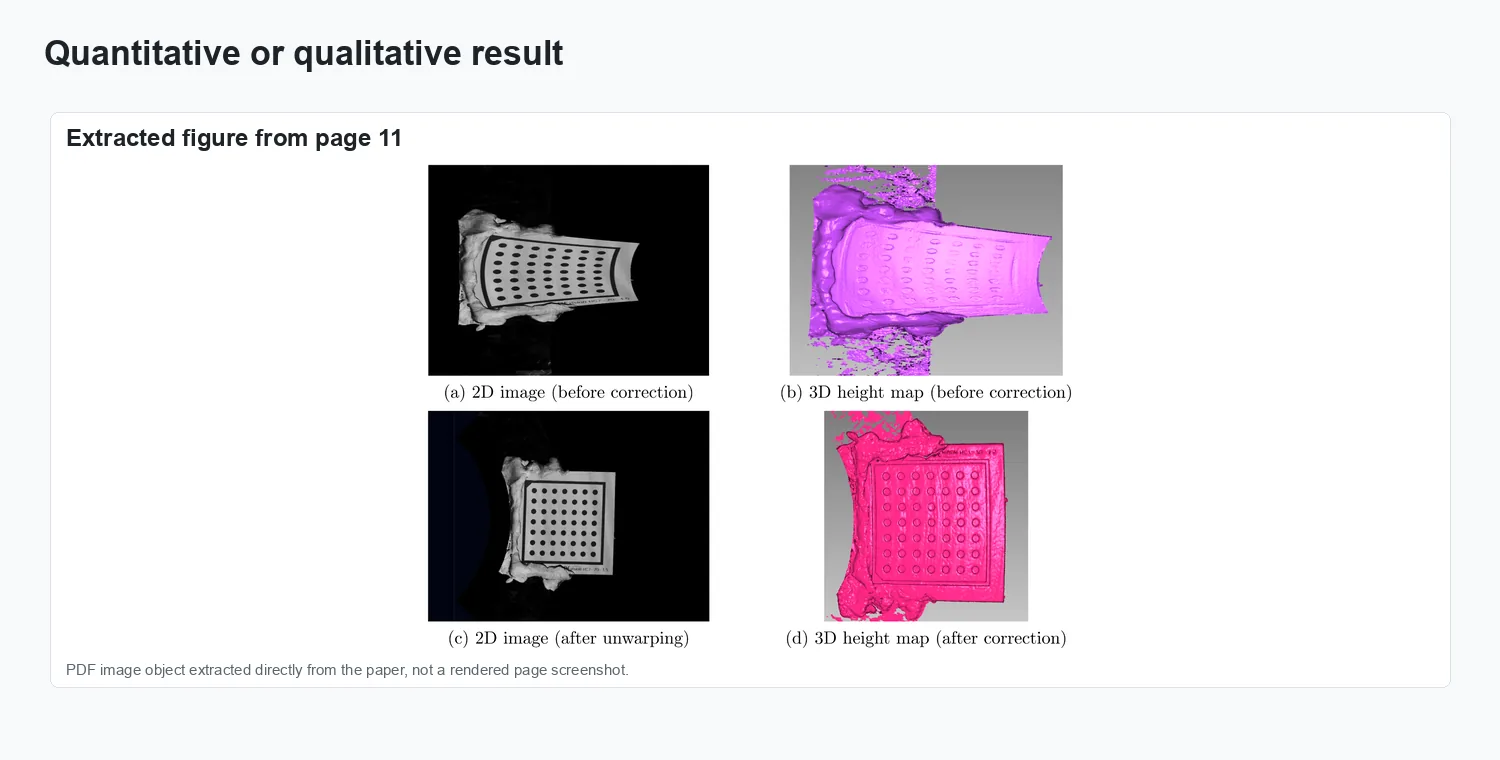
Result comparison.
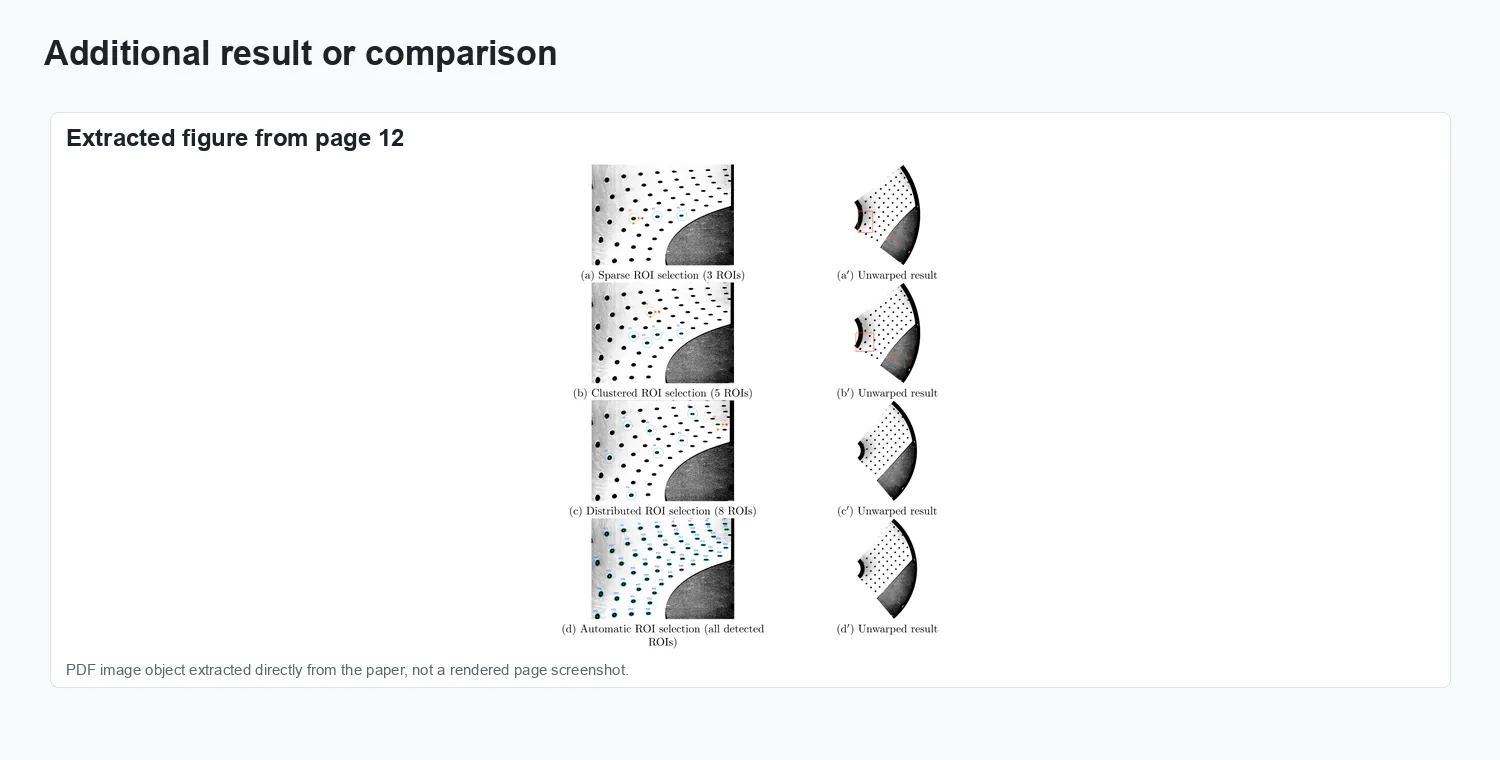
Additional visual result.
Results and impact
The evaluation reported in Optics and Lasers in Engineering, 203:109793 is summarized through the figures above.