Volume Measurement Technology of Dispensing Transparent Adhesives Based on Line Laser Scanning

In one sentenceTransparent adhesive is hard to scan because laser light passes through it. Dispensing it onto a green-yellow substrate that absorbs the violet laser, plus robust stripe-centre extraction, brings the average relative volume error, against weighed reference values, to 1.39%.
The problem
Pneumatic dispensers meter adhesive through air pressure and valve opening time, and fluctuations in air pressure make the amount they deposit uneven. Too much adhesive overflows; too little gives weak bonding or poor airtightness. Measuring the volume of each dispensed bead provides the data needed to calibrate the discharge. For transparent adhesives, though, traditional optical 3D measurement methods show large errors or fail to reconstruct the bead completely.
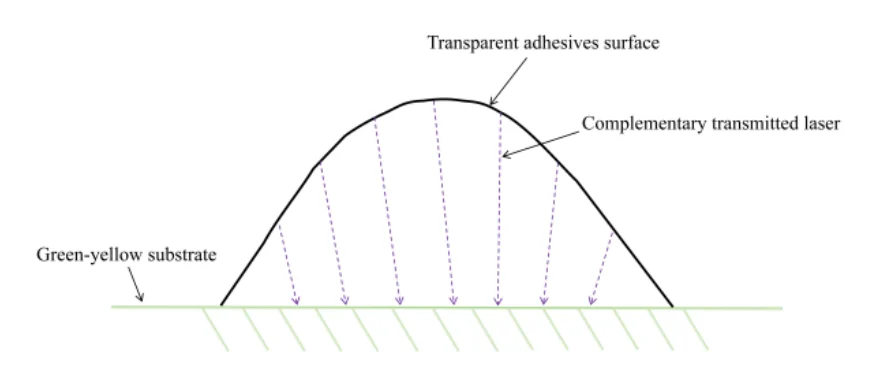
A line-laser scanner works by locating a bright laser stripe in a camera image. On a transparent bead, part of the laser light travels into the adhesive and through it. That transmitted light causes internal scattering and reflection interference, which degrades the 3D reconstruction.
How it works
The method works on two levels. On the optical side, complementary spectral background optimization (CSBO) suppresses the transmitted light through the colour of the substrate alone. On the algorithmic side, an improved stripe-centre extractor collects several candidate points per image row and scores them, so that noise does not end up on the centre line. Geometry analysis then turns the reconstructed surface into a volume.
- Absorb the transmitted light (CSBO). A material absorbs light of one colour and shows the complementary colour, and green-yellow is the complementary colour of violet. The 3D sensor uses a violet laser, so the adhesive is dispensed onto a green-yellow substrate. The substrate absorbs the laser light that passes through the bead, which suppresses scattering and specular reflection without extra measurement tools or equipment.
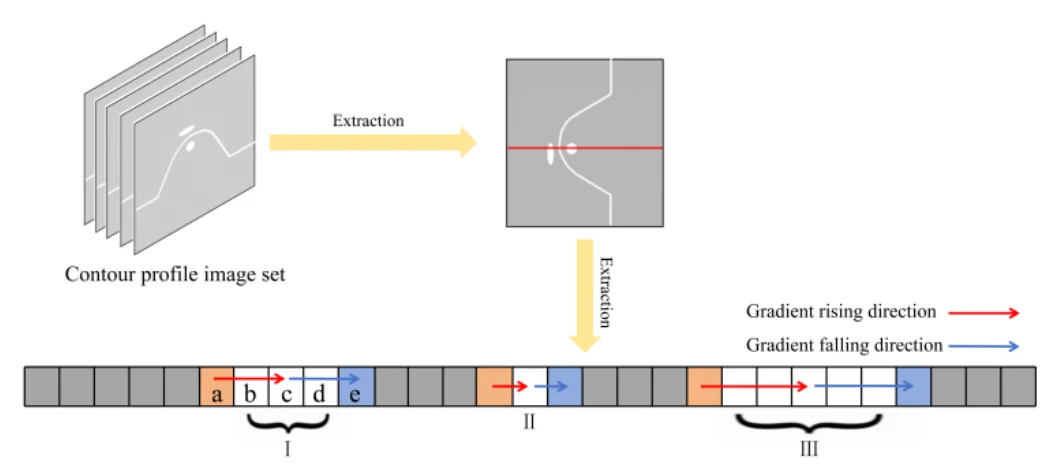
- Find candidate regions in each row. After mean filtering, each pixel row of a stripe image is searched for candidate regions: a region starts where the grey level rises by at least a threshold K and ends where it falls by at least K. One row can contain several regions.
- One candidate centre per region. Within each region, a grey-scale centre of gravity with the weight w(I) = I / (256 − I) gives a candidate centre point; the weight emphasises the brightest pixels.
- Score and select (DWMF-SC). The dynamic weighted multi-factor scoring constraints method scores each candidate as 0.5 × continuity (how many points in the neighbouring rows lie within an offset threshold) + 0.1 × intensity + 0.4 × history (closeness to the point chosen in the previous row). Candidates darker than 10% of the row’s brightest candidate, or from regions wider than 20 pixels, score zero. The highest-scoring candidate is kept, one point per row.
- From centre lines to volume. All centre lines are projected into a depth map. A plane fitted by principal component analysis (PCA) to randomly sampled platform regions defines the datum, and a rigid-body transformation levels the depth map. 3D Otsu thresholding and eight-neighbourhood connectivity analysis segment the adhesive. Each pixel of the adhesive region then counts as a prism with base Δx × Δy and height z, so V = Δx·Δy·Σz.
Results
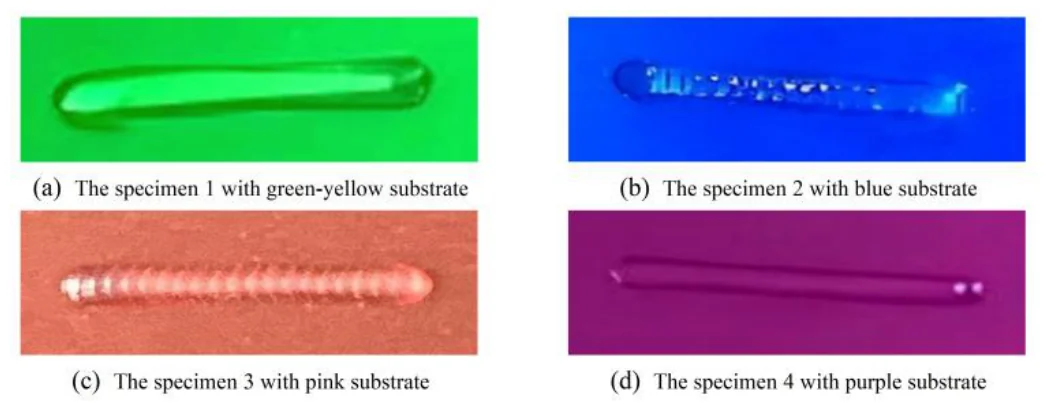
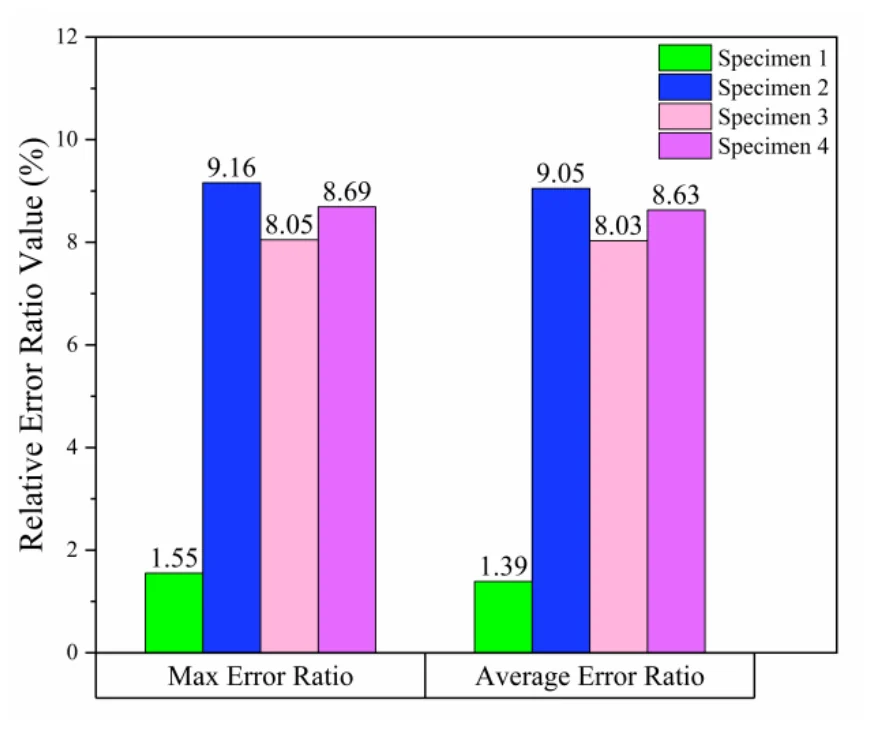
For the volume experiment, a precision dispensing nozzle laid similar straight beads of transparent adhesive onto four substrates (green-yellow, blue, pink and purple), and each specimen was weighed on a precision electronic balance to obtain the reference value. Each specimen was scanned in a workshop environment and measured five times; the predicted weight is the measured volume times the adhesive density, 0.0011 g/mm³. On the green-yellow substrate the five relative errors range from 1.32% to 1.55%; on the other three substrates they range from 8.01% to 9.16%. The authors conclude that CSBO improves the 3D reconstruction accuracy of transparent adhesives.
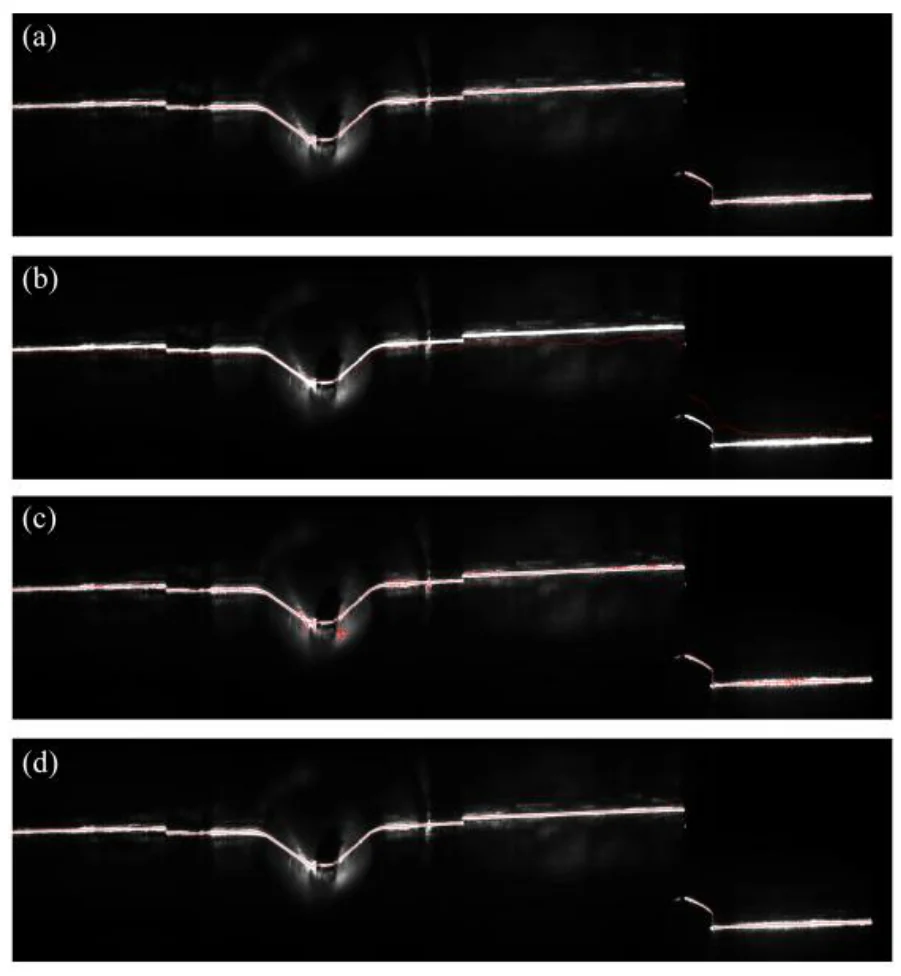
The centre-line experiment uses a stripe image of a metallic part, where surface roughness makes the stripe profile uneven and the metallic lustre adds edge diffusion noise. The Steger method expects a Gaussian stripe profile and extracts multiple centre points near the noisy edges; the gray-scale center of gravity method, computed over the whole column, fails under the noise; and the thinning method extracts part of its skeleton from noise points. The proposed method follows the shape of the stripe with continuous, smooth centre points, which the authors attribute to the candidate points mechanism and the DWMF-SC selection.
Cite
@inproceedings{cao2025volume,
  title={Volume Measurement Technology of Dispensing Transparent Adhesives Based on Line Laser Scanning},
  author={Cao, Ling and Zhou, Renjie and Wang, Xinhua and Pan, Wei},
  booktitle={2025 10th International Conference on Image, Vision and Computing (ICIVC)},
  pages={542--547},
  year={2025},
  organization={IEEE},
  doi={10.1109/icivc66358.2025.11200396}
}