Precision 3D volume measurement of transparent adhesives via spectrally optimized line laser scanning and enhanced centroid extraction
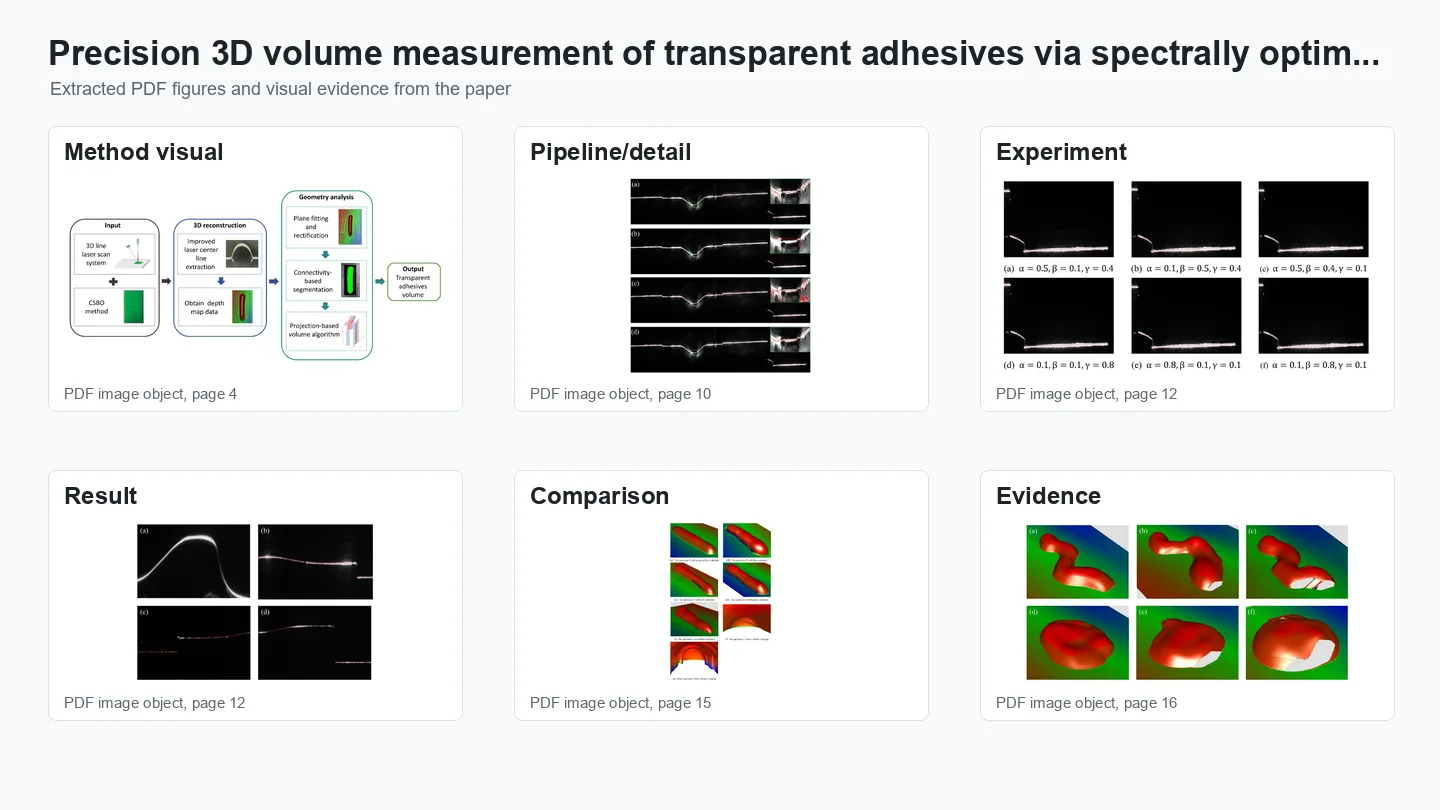
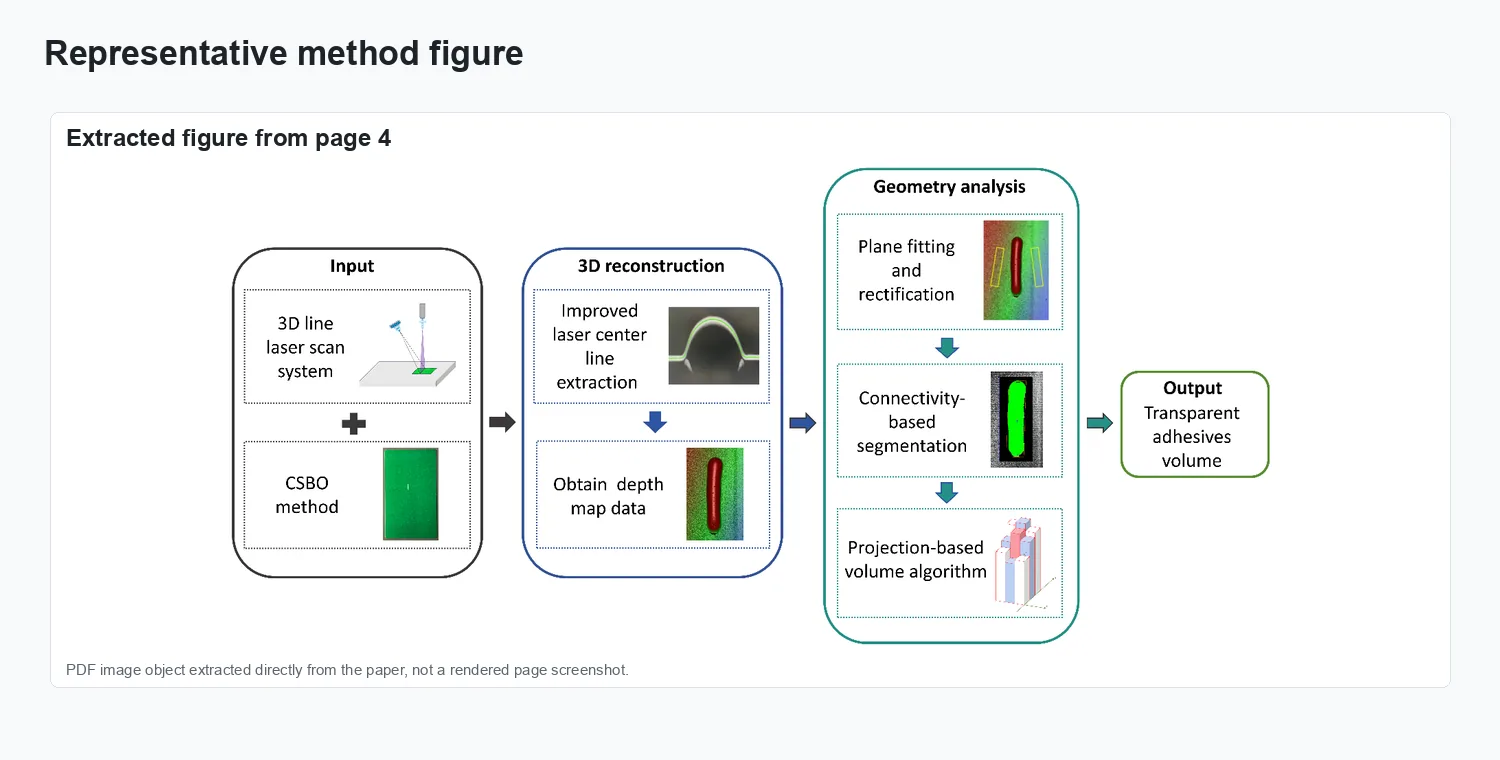
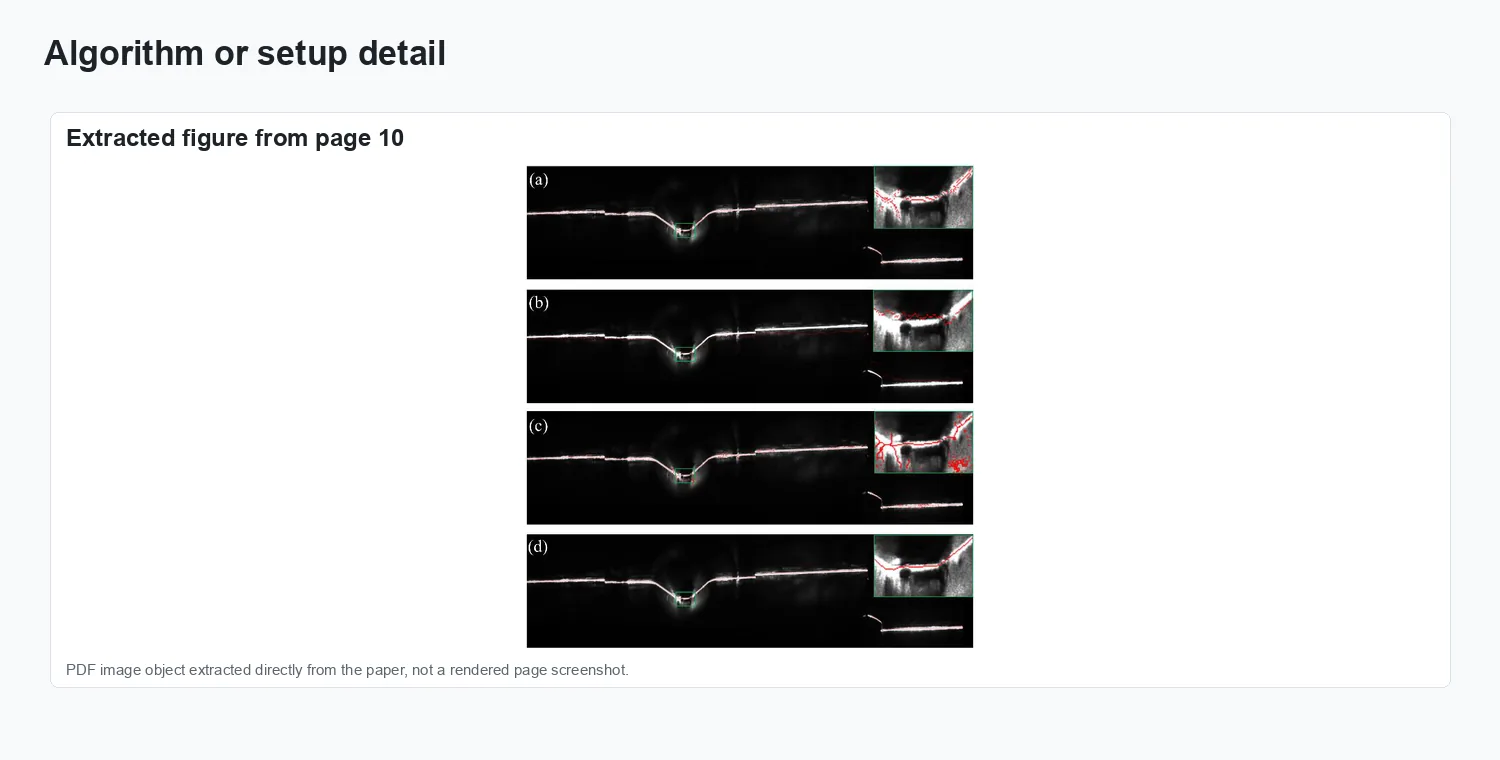
Transparent adhesives pose a fundamental difficulty for structured light and line laser measurement: the material scatters and refracts the illumination internally, producing multiple false stripe peaks and erroneous centroid estimates. Standard centroid extraction algorithms assume a single dominant peak and fail under these conditions, leading to large volume errors. This paper resolves the problem in two complementary steps. First, a spectral optimisation procedure selects the laser wavelength at which the adhesive has maximum absorption, minimising internal scattering. Second, an enhanced centroid extraction algorithm robustly identifies the true surface return even when secondary reflections are present. The integrated system is validated across a range of adhesive types, bead volumes, and substrate materials representative of automotive and consumer electronics assembly lines. Published in Measurement Science and Technology (2025), the work demonstrates sub-millimetre volumetric accuracy and provides a practical, drop-in replacement for existing line laser inspection stations without requiring hardware redesign.
This journal page also groups the earlier ICIVC 2025 conference version, which introduced the transparent-adhesive volume-measurement workflow based on line laser scanning.
Problem setting
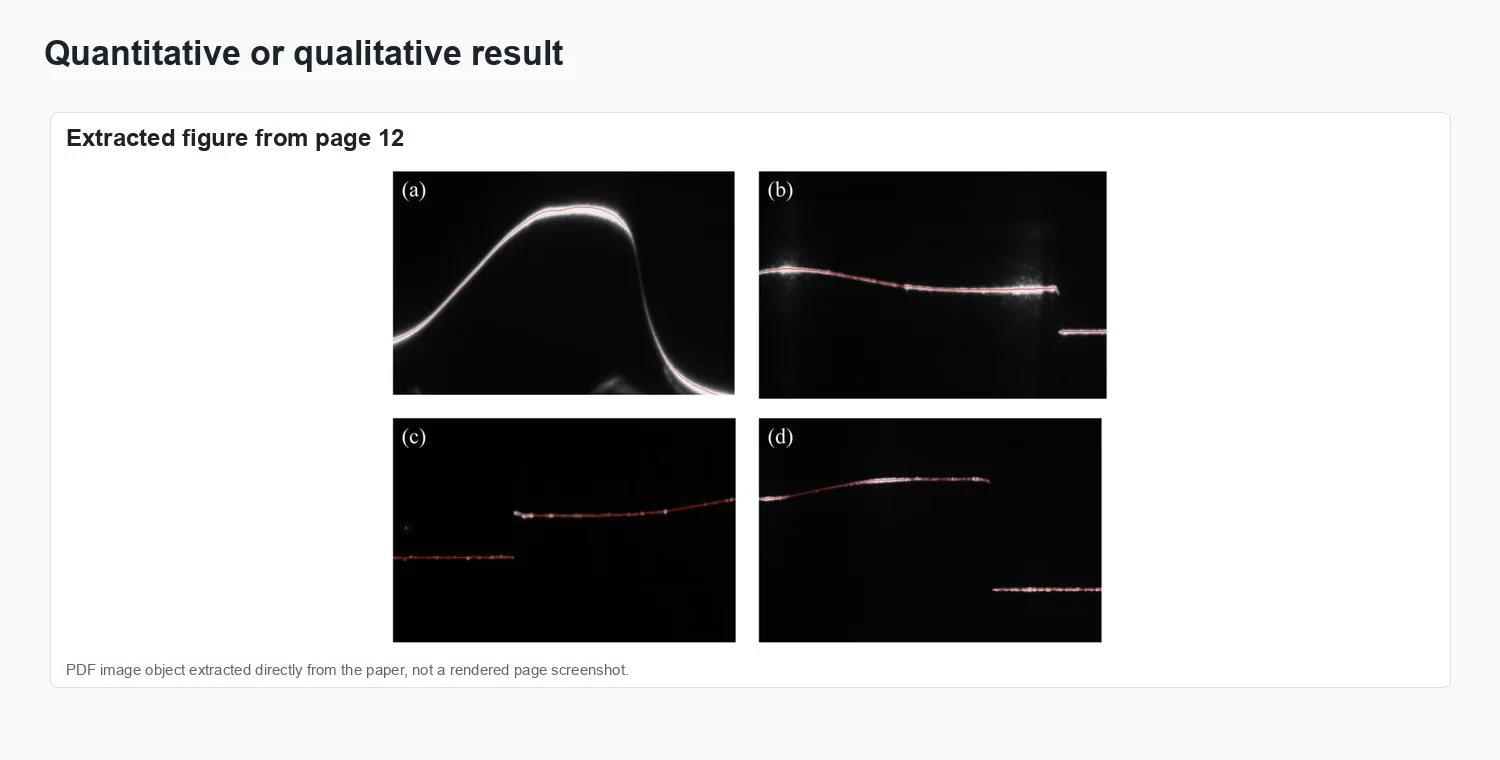
Measuring the volume of transparent adhesive beads on production lines is a critical quality-control challenge because conventional line laser scanners suffer from light scattering and specular reflections inside the adhesive, corrupting the detected laser stripe centroid. This work addresses this by selecting an optimised laser wavelength that maximises absorption contrast within the adhesive, paired with an enhanced centroid extraction algorithm that suppresses multi-reflection noise. The resulting system achieves sub-millimetre volume accuracy on transparent adhesive samples across varying bead sizes and surface conditions.
The figures below collect representative visual evidence from Measurement Science and Technology, 36(11):115206.
Method and visual evidence
The figures below summarize the paper’s workflow and representative visual evidence.
Method overview.
Representation and setup.
Experimental evidence.
Result comparison.
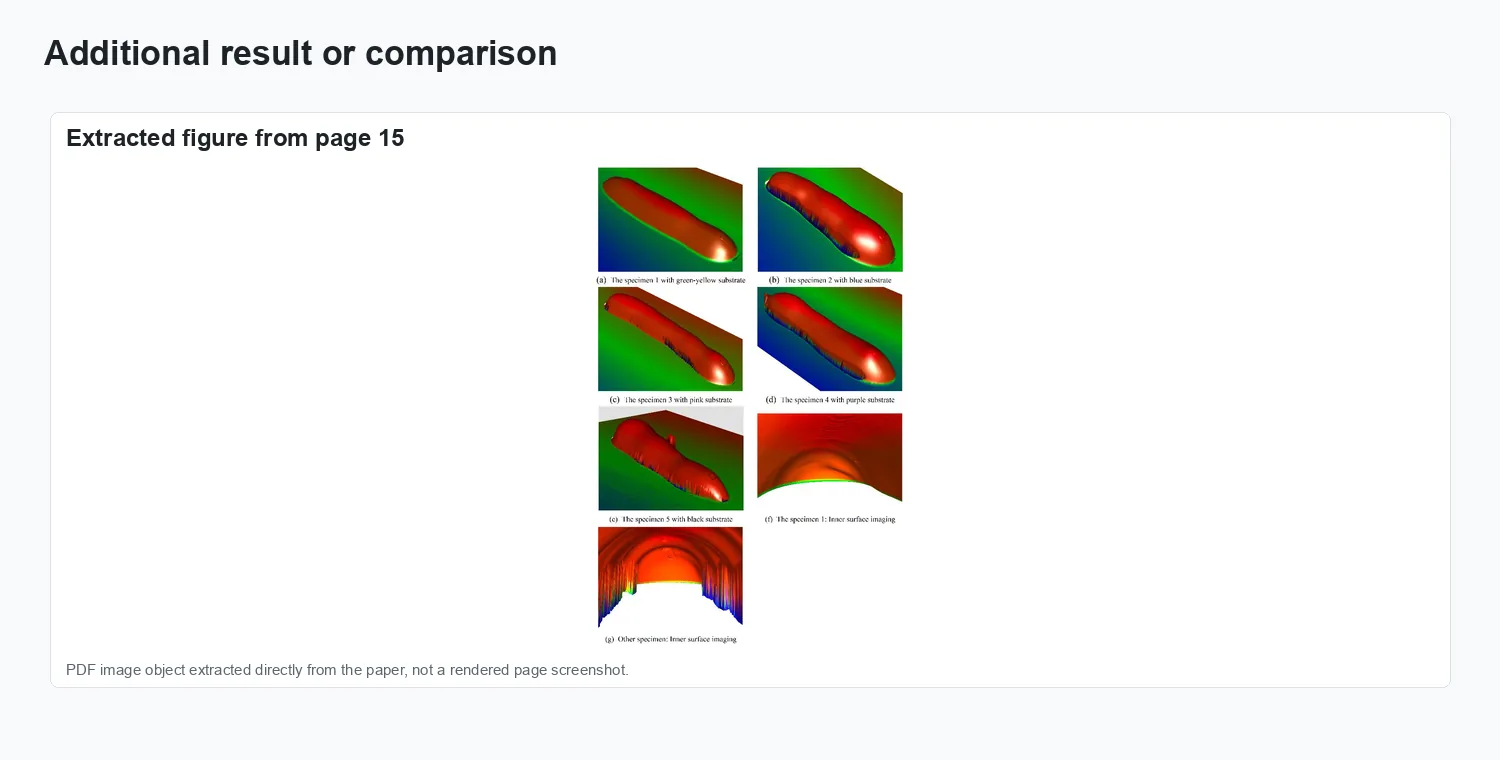
Additional visual result.
Results and impact
The evaluation reported in Measurement Science and Technology, 36(11):115206 is summarized through the figures above.